
Data Collection Methods: Types and Examples


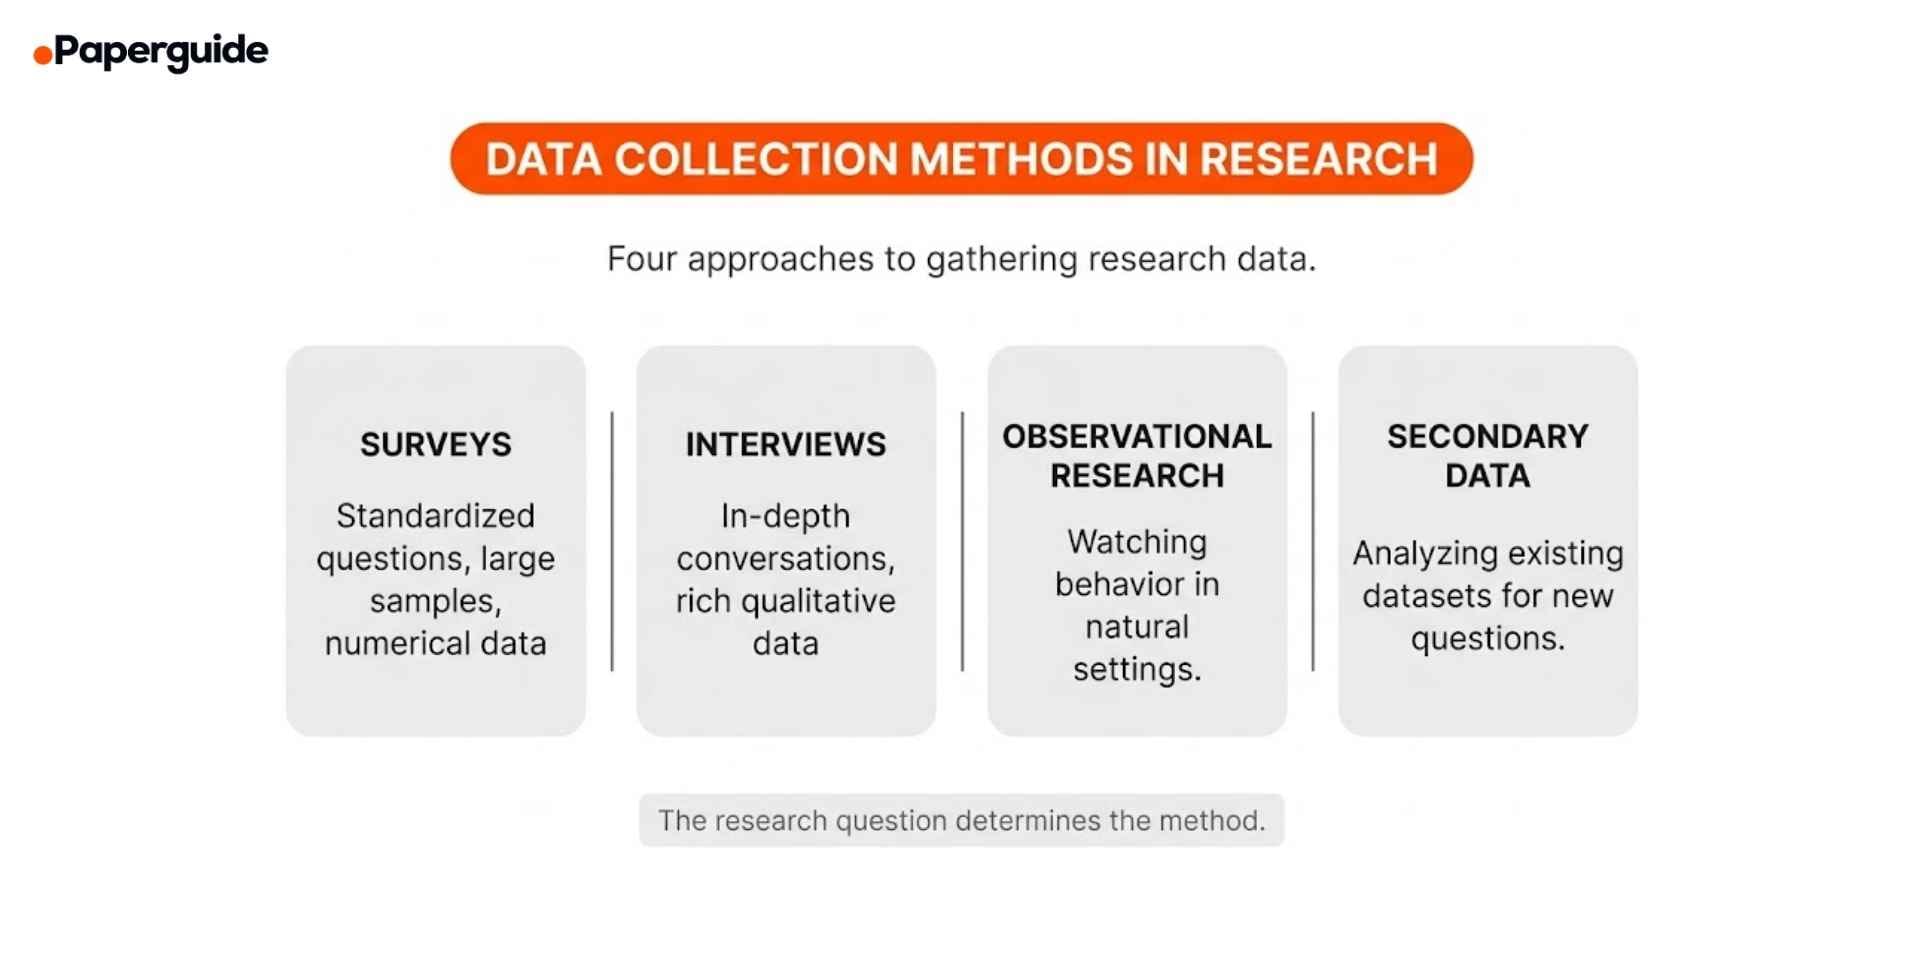
Data collection is the systematic process of gathering information to answer a research question. The method you choose determines the type of data you produce, the depth of insight you can extract, and the conclusions your study can support. The four most widely used methods are surveys, interviews, observation, and secondary data analysis. Each serves a different purpose, and selecting the wrong method is one of the most common reasons research projects produce weak or unusable findings.
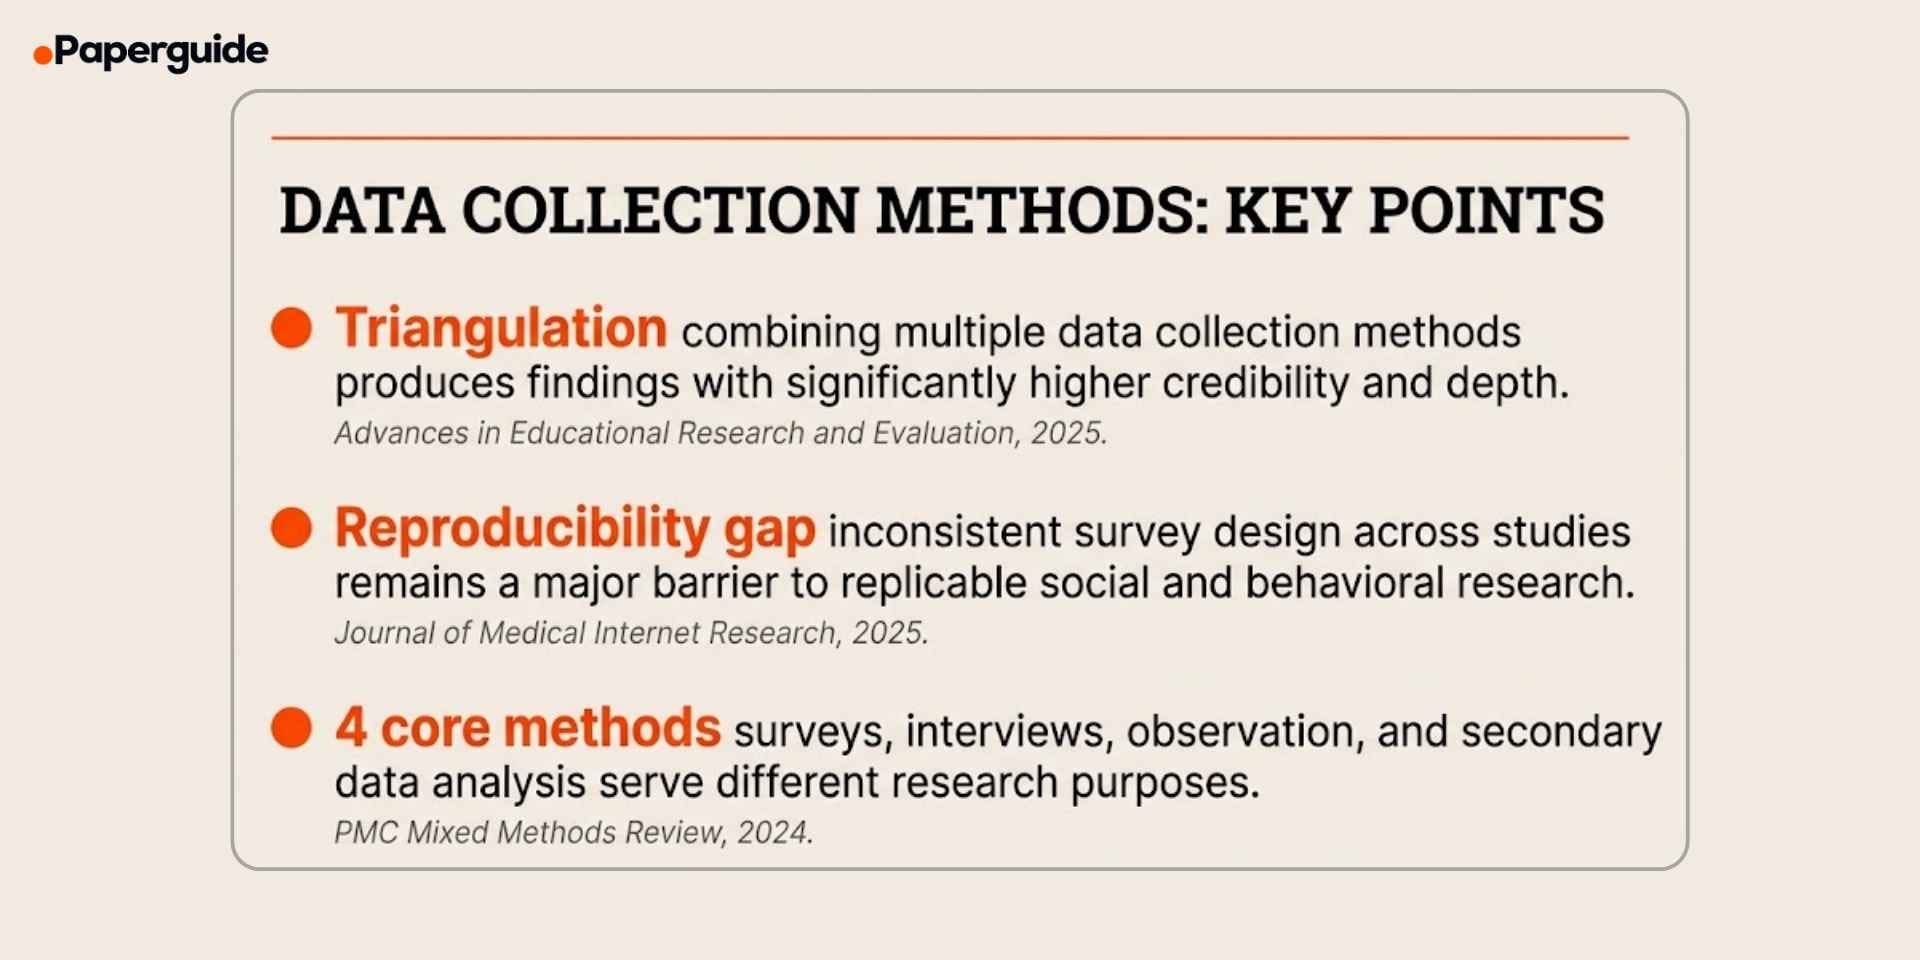
A 2025 review in Advances in Educational Research and Evaluation found that researchers who combine multiple data collection methods through triangulation produce findings with significantly higher credibility and depth than those relying on a single method. Yet most methodology courses teach each method in isolation, leaving students to figure out how and when to combine them. A 2025 study in the Journal of Medical Internet Research introduced a standardized schema ecosystem for survey data collection, finding that inconsistent survey design across studies is a major barrier to reproducibility in social and behavioral research. [1][2]
This guide covers the four primary data collection methods, explains when each is most appropriate, provides examples across disciplines, and includes a decision framework for matching your method to your research question.
Key Takeaways
- Data collection methods fall into two categories: primary (surveys, interviews, observation) and secondary (analysis of existing datasets). The research question determines which category and method to use.
- Surveys are the most efficient method for collecting standardized data from large samples, but poorly designed questions produce unreliable results. [2]
- Interviews generate rich, detailed data about experiences and decision-making processes, but require significant time for both collection and analysis. [1]
- Observation captures behavior in natural settings that participants may not be able to articulate in surveys or interviews.
- Secondary data analysis saves time and resources but introduces challenges around data quality, fit, and researcher disconnect from the original collection context.
- Triangulation, using multiple methods in the same study, strengthens validity and produces more credible findings. [1]
What Are Data Collection Methods in Research?
Data collection methods are the techniques researchers use to gather information for analysis. Every research study, regardless of discipline, requires a deliberate choice about how data will be collected. This choice shapes the entire study: the type of evidence produced, the analytical techniques available, and the kinds of conclusions that can be drawn.
Data collection methods are typically divided into two broad categories. Primary data collection involves gathering new, original data directly from sources through methods like surveys, interviews, or observation. Secondary data collection involves analyzing data that has already been collected by someone else for a different purpose, such as census records, health databases, or published datasets.
The distinction matters because primary data gives researchers full control over what is measured and how, while secondary data offers efficiency and access to large-scale datasets that would be impractical to collect independently. Most well-designed studies consider both options before committing to one.
Primary vs Secondary Data Collection
| Feature | Primary Data | Secondary Data |
|---|---|---|
| Source | Collected directly by the researcher | Collected by others for a different purpose |
| Control | Full control over design and variables | No control over original collection |
| Cost | Higher (time, funding, personnel) | Lower (data already exists) |
| Time | Longer collection period | Faster access |
| Fit | Tailored to the research question | May not perfectly match the question |
| Sample | Researcher selects the sample | Sample determined by original study |
| Recency | Current data | May be outdated |
| Depth | Can be customized for depth | Limited to what was originally collected |
The choice between primary and secondary data depends on your research question, budget, timeline, and the availability of existing data. Many strong studies use both: secondary data to establish context and primary data to answer the specific research question.
Surveys
Surveys collect standardized responses from a defined sample using structured questions. They are the most common data collection method in social science, health research, and business research because they can reach large populations efficiently.
Types of Surveys
Questionnaires use closed-ended questions (Likert scales, multiple choice, ranking) to produce numerical data for statistical analysis. They are best suited for measuring attitudes, opinions, behaviors, and demographic characteristics.
Structured interviews follow a fixed set of questions asked in the same order to every participant. They combine the standardization of questionnaires with the personal interaction of interviews, making them useful when participants may need clarification.
Online surveys use digital platforms to distribute questionnaires to large, geographically dispersed samples. The 2025 JMIR study on reproducible survey design found that online surveys now dominate data collection in behavioral research but suffer from inconsistent design standards that reduce cross-study comparability. [2]
When to Use Surveys
Surveys are the right choice when you need to collect data from a large sample, when your variables can be measured through self-report, and when you need standardized responses that allow for statistical comparison. They work well for measuring attitudes, prevalence, frequency, and relationships between variables.
Survey Example
A public health researcher wants to measure vaccine confidence among parents of school-age children. They design a 25-item questionnaire using validated scales measuring perceived vaccine safety, trust in healthcare providers, and information sources. The survey is distributed to 3,000 parents across five school districts. Data analysis reveals that parents who rely primarily on social media for health information score 35% lower on vaccine confidence scales than those who consult healthcare providers directly.
Limitations
Surveys cannot capture depth. They tell you what people report but not why they report it. Response bias, social desirability, and poorly worded questions can distort findings. Low response rates threaten the representativeness of the sample. Researchers using academic search engines to review published survey instruments in their field can avoid common design errors by adapting validated scales rather than creating questions from scratch.
Interviews
Interviews involve direct conversation between the researcher and participant, producing detailed qualitative data about experiences, perspectives, and decision-making processes. They range from highly structured (fixed questions) to unstructured (open conversation guided by broad topics).
Types of Interviews
Semi-structured interviews use a prepared guide with key questions but allow the researcher to follow up on unexpected responses. They balance consistency with flexibility and are the most commonly used format in qualitative research.
Unstructured interviews begin with a broad topic and allow the conversation to develop naturally. They produce the richest data but are the hardest to analyze systematically.
Focus groups bring together six to twelve participants for a moderated group discussion. They are particularly useful for exploring shared experiences, social norms, and how people construct meaning through interaction.
When to Use Interviews
Use interviews when your research question asks about experiences, meanings, perceptions, or decision-making processes. They are essential when you need to understand the "why" behind behaviors that surveys can identify but cannot explain. Interviews are also appropriate when studying sensitive topics where trust between researcher and participant matters.
Interview Example
An education researcher wants to understand why experienced teachers leave the profession within the first ten years. They conduct semi-structured interviews with 22 former teachers, asking about their initial motivations, daily experiences, turning points, and final decisions. Thematic analysis reveals three core themes: administrative burden outweighing classroom satisfaction, lack of professional autonomy, and emotional exhaustion from managing student behavior without institutional support. These themes would not have emerged from a survey asking teachers to rate their satisfaction on a numerical scale.
Limitations
Interviews are time-intensive for both collection and analysis. A single one-hour interview can produce 10,000 to 15,000 words of transcript that must be coded and analyzed. The researcher's presence can influence participant responses (interviewer effect). Small sample sizes mean findings are transferable rather than generalizable. The 2025 review in Advances in Educational Research and Evaluation emphasized that managing the volume of qualitative data from interviews remains one of the most significant practical challenges in field research. [1]
Observation
Observation involves systematically watching and recording behavior, interactions, or events in natural or controlled settings. It captures what people actually do, which may differ from what they say they do in surveys or interviews.
Types of Observation
Participant observation requires the researcher to immerse themselves in the setting being studied, participating in activities while simultaneously documenting what they observe. This is the core method of ethnographic research.
Non-participant observation involves watching and recording without participating. The researcher remains an outsider, reducing the risk of influencing the behavior being observed but potentially missing contextual nuances that come from participation.
Structured observation uses predetermined categories and coding schemes to record specific behaviors systematically. It produces quantifiable data and is common in behavioral psychology and educational research.
When to Use Observation
Use observation when you need to document actual behavior rather than self-reported behavior. It is essential when studying interactions, processes, or environments where context matters. Observation is also valuable when participants may lack awareness of their own behavior or when self-report would be unreliable.
Observation Example
A workplace researcher wants to study how open-plan office layouts affect collaboration and interruption patterns. Rather than surveying employees about their experiences (which would capture perceptions, not behavior), the researcher conducts structured observation over four weeks, recording the frequency, duration, and type of interactions at 30-minute intervals throughout the workday. Findings show that employees in open-plan offices have 73% more face-to-face interactions but that 62% of these are unplanned interruptions lasting under two minutes, suggesting that open layouts increase contact but not meaningful collaboration.
Limitations
Observation is labor-intensive and limited in scale. The Hawthorne effect (participants changing behavior because they know they are being observed) can compromise findings. Observer bias, where the researcher's expectations influence what they notice and record, requires mitigation through inter-rater reliability checks and structured coding protocols. Ethical considerations around consent and privacy are more complex in observational research than in surveys or interviews.
Secondary Data Analysis
Secondary data analysis involves using data that was originally collected for a different purpose to answer a new research question. Sources include government datasets, health records, educational databases, published research data, and organizational archives.
Types of Secondary Data
Government and institutional datasets include census data, labor statistics, health surveillance data, and educational performance records. These offer large, representative samples that individual researchers could not collect independently.
Published research datasets are increasingly available through open data repositories. Many journals now require authors to deposit their data, making it accessible for reanalysis and replication.
Organizational records include internal databases, patient records, transaction histories, and administrative data. These are particularly valuable in health services research and business research.
When to Use Secondary Data
Use secondary data when your research question can be answered with existing data, when collecting primary data would be prohibitively expensive or time-consuming, when you need access to large populations or historical trends, or when you want to replicate or extend previous findings. A 2024 practical guide found that researchers who combine secondary data with primary data in mixed methods designs produce more comprehensive findings by pairing large-scale patterns with contextual depth. [3]
Secondary Data Example
A health economist wants to examine the relationship between income inequality and life expectancy across countries over the past 30 years. Collecting this data from scratch would be impossible for a single researcher. Instead, they use World Bank income data, WHO mortality data, and OECD health expenditure data. Panel regression analysis reveals that countries with higher income inequality show a 2.1-year lower average life expectancy even after controlling for total healthcare spending, GDP per capita, and education levels.
Researchers working with multiple datasets from different sources often benefit from using Google Scholar alternatives to search across specialized databases and locate the most complete and current versions of public datasets.
Limitations
The researcher has no control over how the data was originally collected, which means variables may not align perfectly with the current research question. Data quality, sampling decisions, and measurement choices were made by someone else. The original context may be poorly documented, creating gaps in understanding what the data actually represents. Missing variables that are critical to the new research question cannot be added after the fact.
How to Choose the Right Data Collection Method
Step 1: Start With Your Research Question
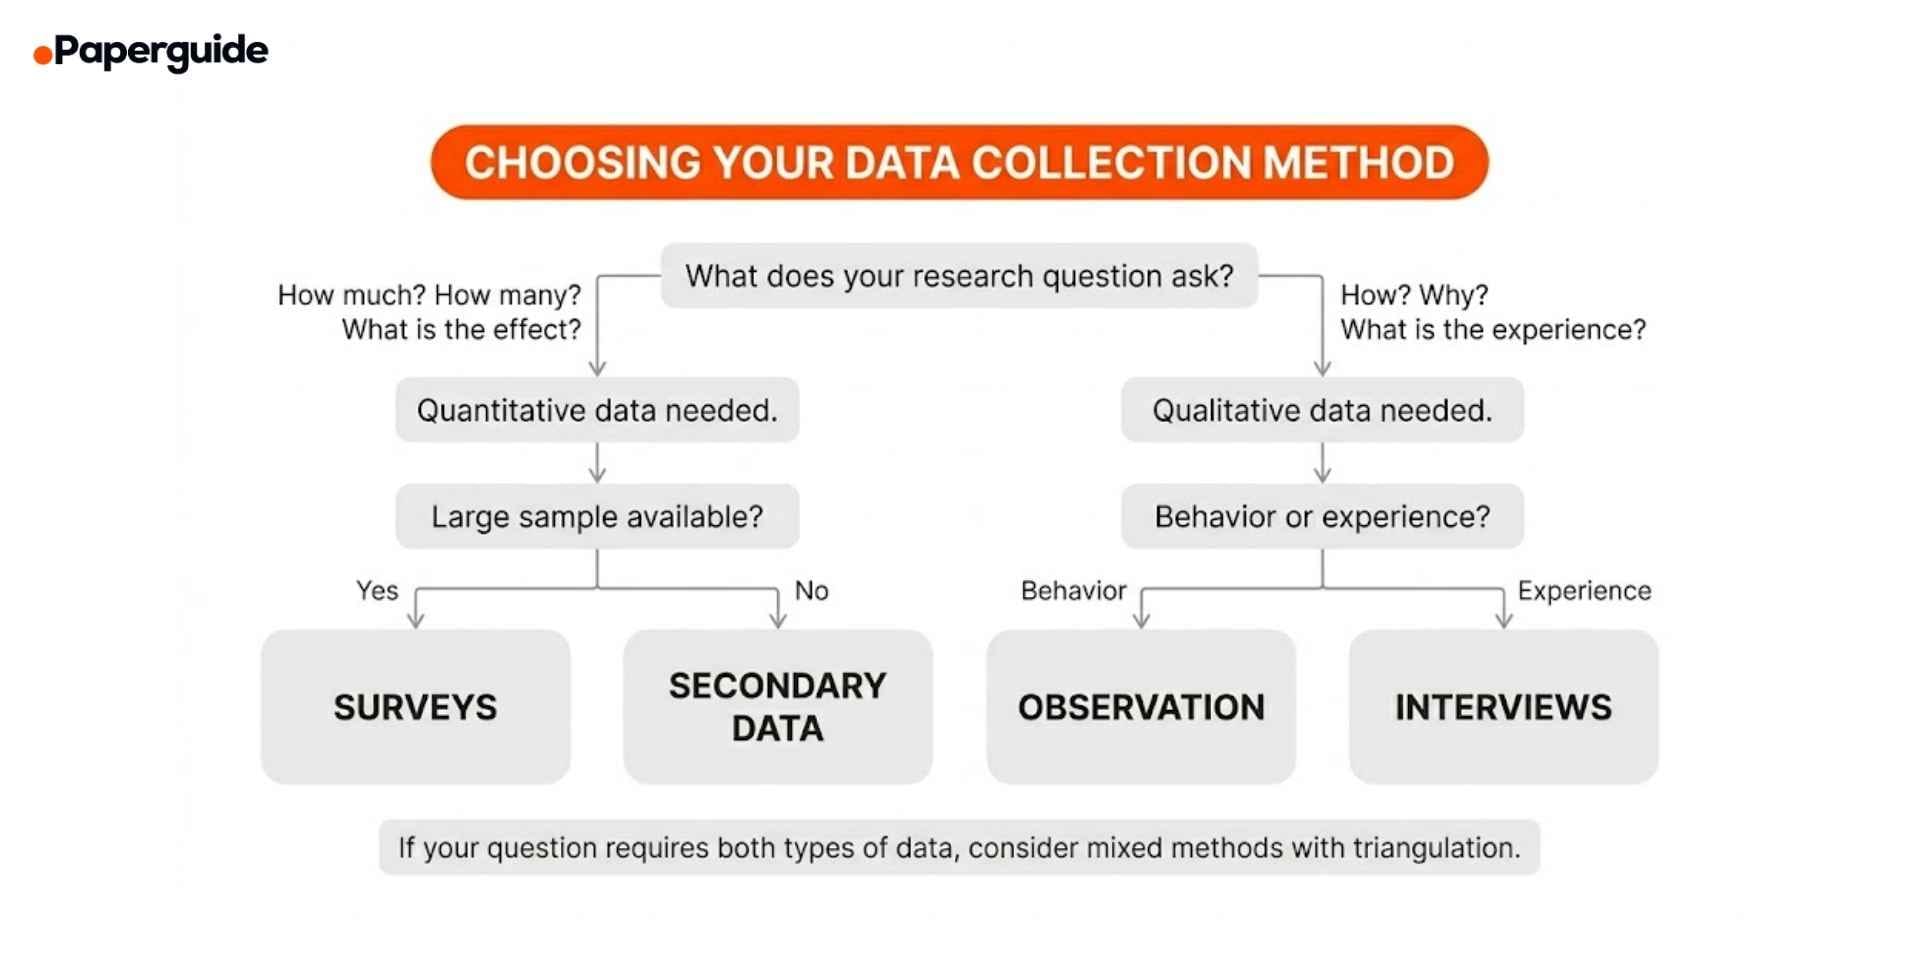
The research question determines everything. If it asks about prevalence, frequency, or relationships between variables, you need quantitative data (surveys, secondary data). If it asks about experiences, meanings, or processes, you need qualitative data (interviews, observation). If it asks both types of questions, you need mixed methods.
Step 2: Consider Your Resources
Each method requires different resources. Surveys require instrument development and access to large samples. Interviews require time for data collection and coding expertise for analysis. Observation requires sustained access to a research setting. Secondary data requires access to relevant datasets and the statistical expertise to analyze them.
Step 3: Evaluate Practical Constraints
Consider your timeline, budget, sample access, and ethical requirements. A PhD student with limited funding may benefit from secondary data analysis combined with a small number of interviews. A funded research team may have the resources for a large-scale survey with follow-up focus groups.
Step 4: Assess Data Availability
Before committing to primary data collection, check whether existing data can answer your question. Search published datasets, government databases, and institutional archives. If suitable data exists, secondary analysis may be more efficient. If the data does not match your specific question, primary collection is necessary.
Step 5: Consider Triangulation
A 2025 study on discordant findings in mixed methods research found that studies using methodological triangulation, combining surveys with interviews or observation, are better equipped to identify and resolve contradictions that single-method studies would miss entirely. If your question is complex, plan to combine methods from the start rather than treating triangulation as an afterthought. [4]

Common Mistakes and How to Fix Them
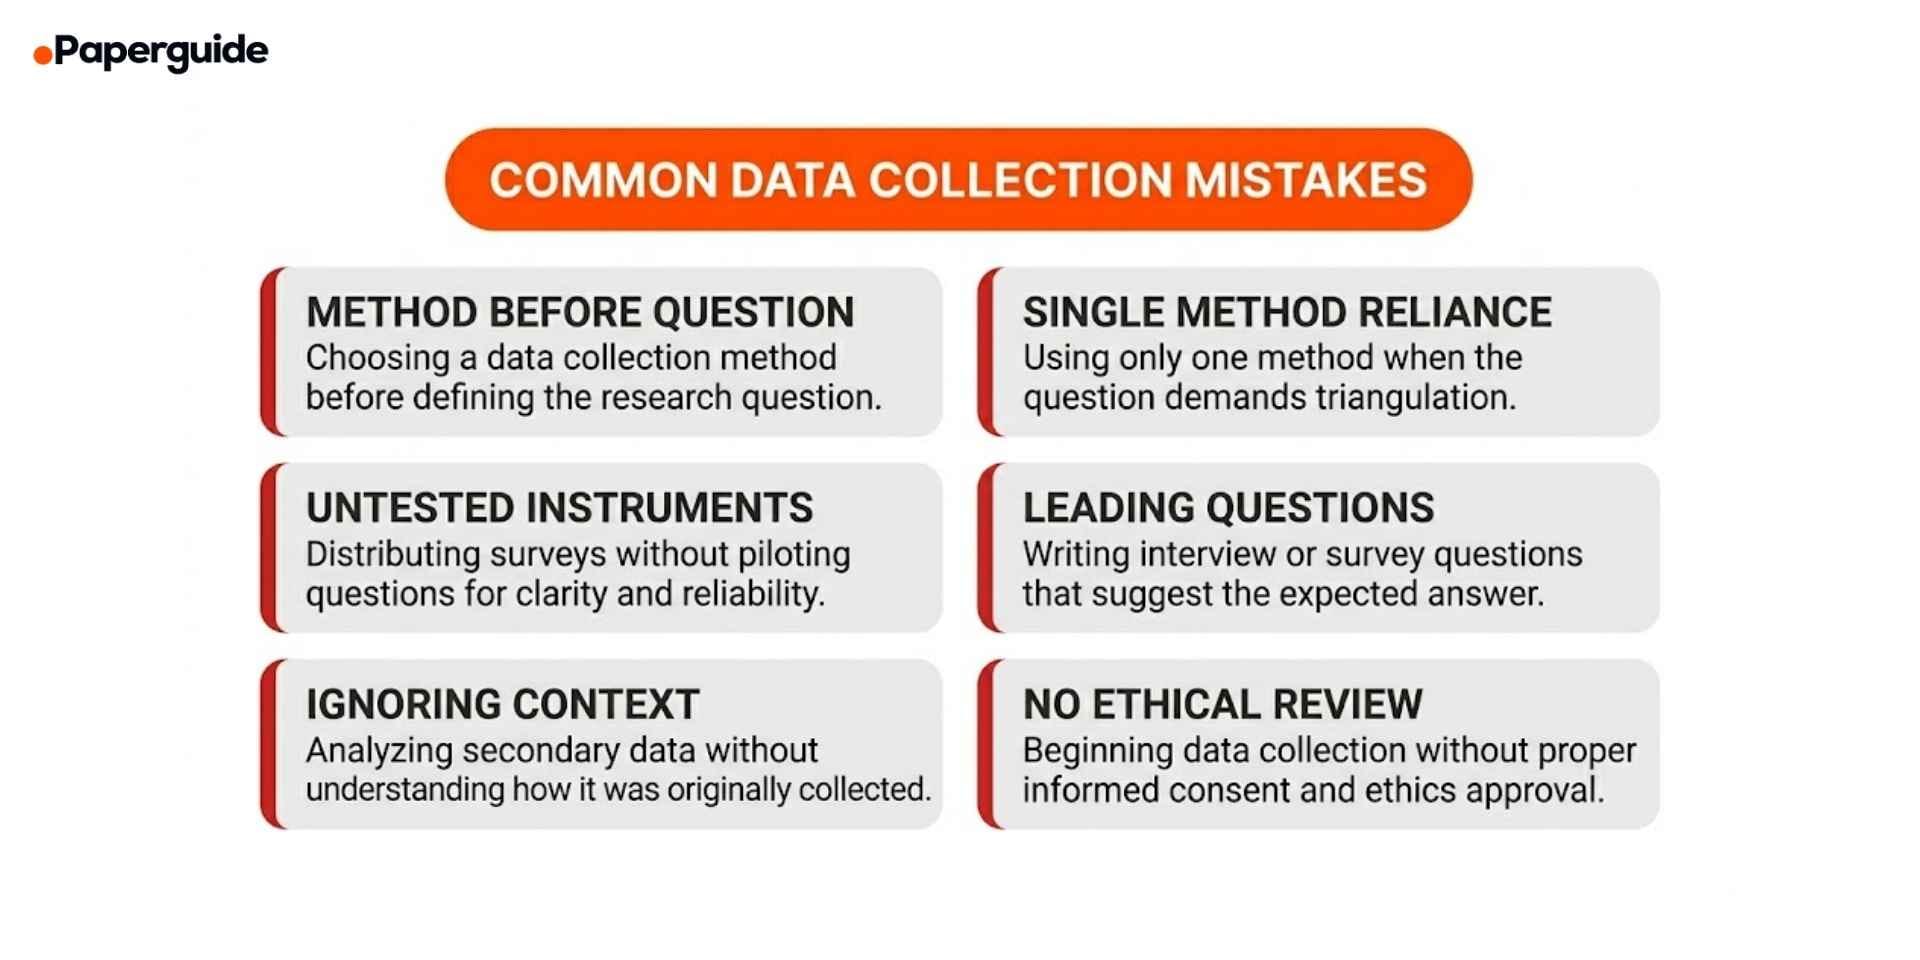
Mistake 1: Choosing the Method Before the Question
Error: Deciding to "do a survey" or "conduct interviews" before clearly defining what you need to find out.
Fix: Write the research question first. Then ask: what type of data does this question require? The answer determines the method. If the question asks "how many," you need surveys or secondary data. If it asks "how" or "why," you need interviews or observation.
Mistake 2: Relying on a Single Method When Triangulation Is Needed
Error: Using only a survey when the research question requires both statistical measurement and contextual understanding.
Fix: Evaluate whether your question has both quantitative and qualitative dimensions. If it does, plan a mixed methods design from the start. A 2025 review in BMJ Mental Health found that mental health research increasingly uses mixed methods because single-method studies fail to capture the complexity of psychological phenomena. [5]
Mistake 3: Distributing Untested Survey Instruments
Error: Sending out a survey without piloting it, leading to ambiguous questions, low completion rates, and unusable data.
Fix: Always pilot your survey with a small group (10 to 20 participants) before full distribution. Check for question clarity, completion time, and response patterns. Revise any item that produces confusion or uniform responses.
Mistake 4: Writing Leading Questions
Error: Framing interview or survey questions in ways that suggest the desired answer. For example: "Don't you agree that AI tools improve research efficiency?"
Fix: Use neutral phrasing. Instead: "How has the use of AI tools affected your research process?" Open-ended, non-directional questions produce more honest and varied responses.
Mistake 5: Analyzing Secondary Data Without Understanding Its Context
Error: Running statistical analyses on a dataset without investigating how it was collected, what the sampling strategy was, or what limitations the original researchers identified.
Fix: Read the original methodology documentation thoroughly. Understand the sampling frame, collection procedures, and any known biases. If the dataset documentation is insufficient, contact the original research team or find a better-documented alternative.
Mistake 6: Skipping Ethical Review
Error: Beginning data collection, especially interviews or observation, without obtaining informed consent or ethics committee approval.
Fix: Submit your data collection plan to your institutional review board (IRB) or ethics committee before beginning. Prepare informed consent forms that clearly explain the study purpose, data usage, anonymity protections, and the participant's right to withdraw at any time.
Data Collection Planning Checklist
- [ ] Research question is clearly defined. The question specifies what you need to find out.
- [ ] Data type is identified. Numerical data for measurement questions, textual data for experience questions, or both for mixed methods.
- [ ] Method matches the question. Surveys for prevalence, interviews for experience, observation for behavior, secondary data for existing patterns.
- [ ] Instruments are developed or selected. Survey questions are validated, interview guides are prepared, observation protocols are designed.
- [ ] Pilot testing is completed. Instruments have been tested and revised before full data collection.
- [ ] Sample is defined and justified. Sample size is appropriate for the method (power analysis for quantitative, saturation plan for qualitative).
- [ ] Ethical approval is obtained. IRB or ethics committee has reviewed and approved the study.
- [ ] Data storage and security plan is in place. Collected data will be stored securely with appropriate anonymization.
- [ ] Analysis plan is specified. Statistical tests or coding methods are determined before data collection begins.
- [ ] Triangulation is considered. Multiple methods are planned if the research question requires both depth and breadth.
Researchers managing references and sources across multiple data collection instruments benefit from using AI reference manager tools to organize citations, track methodological sources, and maintain consistency across the research project.
Validate This With Papers (2 Minutes)
Before finalizing your data collection plan, check how published studies in your field have approached similar research questions. This confirms that your methodological choice is consistent with disciplinary norms.
Step 1: Search for recent studies that investigated a similar research question. Note which data collection methods they used and how they justified that choice.
Step 2: Open two or three relevant papers. Look at the methodology section for data collection procedures, sample size rationale, and any discussion of method limitations. Exploring Google Scholar alternatives can help you search across specialized databases to find methodology-focused papers in your field.
Step 3: Use an Essay Expander to develop brief methodological notes into full paragraphs for your own methodology section. Compare your planned approach with established practices.
This takes about two minutes and ensures your data collection method aligns with what reviewers and committees in your field expect.
Conclusion
Data collection is not a procedural formality. It is a methodological decision that shapes every aspect of a research study, from the type of evidence produced to the conclusions that can be drawn. Surveys measure attitudes and behaviors at scale. Interviews capture depth and meaning. Observation documents what people actually do rather than what they say they do. Secondary data analysis leverages existing datasets to answer new questions efficiently.
The research question always comes first. Match the method to the question, not the other way around. Pilot your instruments, plan for triangulation when complexity demands it, and secure ethical approval before collecting any data. Strong research starts with strong data collection, and strong data collection starts with a clear understanding of what each method can and cannot do.
Frequently Asked Questions
What are the four main data collection methods?
The four main data collection methods are surveys, interviews, observation, and secondary data analysis. Surveys collect standardized responses from large samples. Interviews generate detailed qualitative data through conversation. Observation records behavior in natural settings. Secondary data analysis uses existing datasets to answer new research questions.
What is the difference between primary and secondary data collection?
Primary data collection involves gathering new, original data directly from participants or settings for your specific research question. Secondary data collection involves analyzing data that was previously collected by someone else for a different purpose. Primary data gives you full control over design but costs more. Secondary data is more efficient but may not perfectly match your question.
How do I choose the right data collection method for my study?
Start with your research question. If it asks about prevalence, frequency, or causal relationships, use quantitative methods like surveys or secondary data analysis. If it asks about experiences, meanings, or processes, use qualitative methods like interviews or observation. If the question has both dimensions, plan a mixed methods study that combines approaches.
Can I use more than one data collection method in a single study?
Yes. Using multiple methods is called triangulation, and it strengthens the validity of findings. Common combinations include surveys followed by interviews (explanatory sequential design), or observation combined with secondary data analysis. Mixed methods designs require planning the integration point where data from different methods are combined and compared.
How many participants do I need for each data collection method?
Sample size depends on the method. Surveys typically require hundreds or thousands of participants for statistical power. Interviews aim for data saturation, usually between 12 and 30 participants. Focus groups typically need three to five groups of six to twelve participants each. Observation studies vary widely depending on the setting and duration of data collection.
What are the biggest challenges in data collection?
The biggest challenges include ensuring data quality and accuracy, managing response bias in surveys, handling the large volume of qualitative data from interviews, maintaining objectivity during observation, and dealing with data fit issues in secondary analysis. Piloting instruments, training data collectors, and following structured protocols help mitigate these challenges.
References
- Chand, S. P. "Methods of Data Collection in Qualitative Research: Interviews, Focus Groups, Observations, and Document Analysis." Advances in Educational Research and Evaluation, 6(1), 2025.
- Chent, Y. et al. "Standardizing Survey Data Collection to Enhance Reproducibility: Development and Comparative Evaluation of the ReproSchema Ecosystem." Journal of Medical Internet Research, 27, 2025.
- Lorenzini, E. "Practical Guide to Achieve Rigor and Data Integration in Mixed Methods Research." , 42(3), 2024.
- Page-Reeves, J. et al. "Interpreting Discordant Results in Mixed-Method Research: Data Triangulation, Participant Voices, and Epistemic Issues in Health Research." PageInternational Journal of Social Research Methodology, 2025.
- Demkowicz, O. et al. "Advancing Mixed Methods in Mental Health Research." BMJ Mental Health, 28(1), 2025.