
What Is Descriptive Research? (Methods and Examples)


Descriptive research is the most widely used research design across the social sciences, education, public health, and business. Its purpose is straightforward: to describe what exists, document characteristics, and identify patterns within a population or phenomenon without manipulating any variables. Unlike experimental research, descriptive research does not test cause and effect. It answers "what is" rather than "why" or "what would happen if."
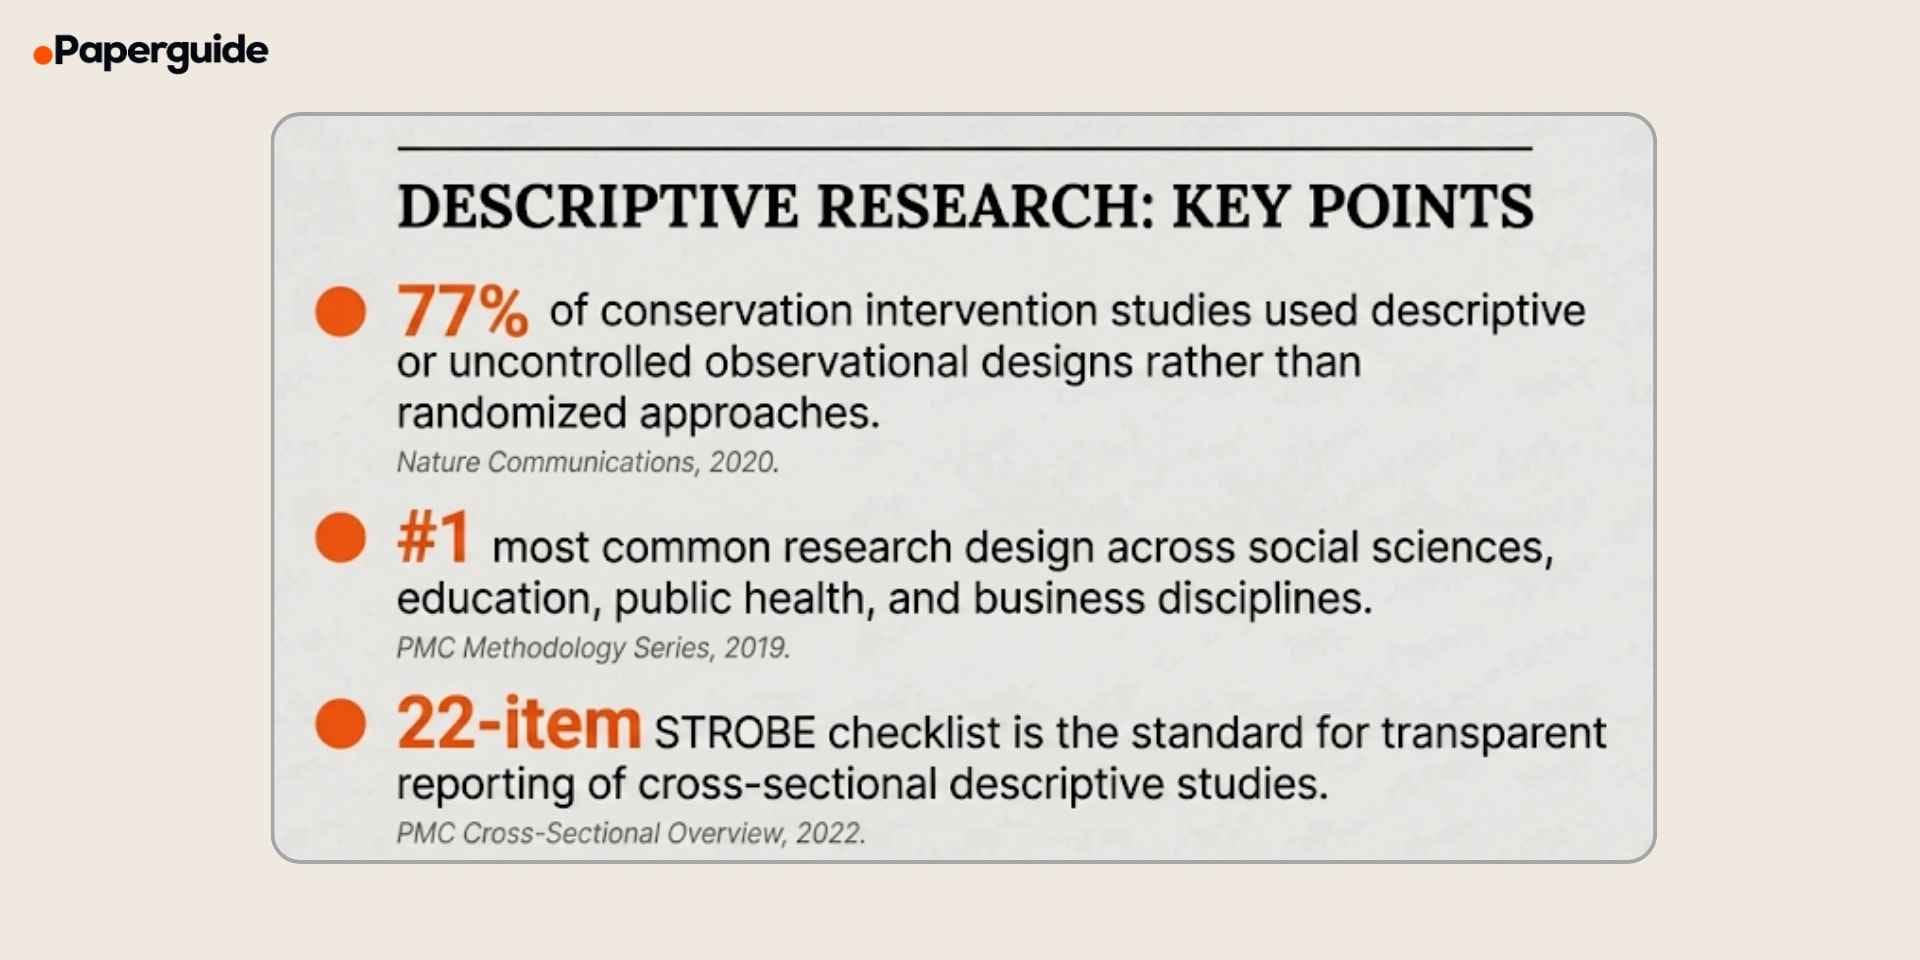
Despite its simplicity, descriptive research plays a critical role in the broader research ecosystem. A large-scale analysis published in Nature Communications found that only 23% of intervention studies in biodiversity conservation and 36% in social science used randomized or controlled designs; the remaining majority relied on descriptive or uncontrolled observational approaches, making descriptive designs the backbone of published evidence in these fields.. [1]
Yet descriptive research is also where many methodological problems begin. When researchers treat descriptive findings as causal evidence, overgeneralize from convenience samples, or fail to report their methods transparently, the results lose credibility. This guide explains what descriptive research is, the main methods used to conduct it, examples across disciplines, common mistakes, and a checklist for designing a rigorous descriptive study.
Key Takeaways
- Descriptive research describes what exists in a population or phenomenon without manipulating variables or testing cause and effect.
- It is the most common research design in the social sciences, education, and public health, with over 77% of conservation intervention studies relying on descriptive or uncontrolled observational designs. [1]
- The three main descriptive methods are surveys, observational studies, and case studies.
- Descriptive research is essential for documenting prevalence, identifying patterns, and generating hypotheses for future experimental studies.
- The STROBE 22-item checklist provides the standard for transparently reporting cross-sectional descriptive studies. [2]
- Use the checklist and template in this guide to design a rigorous descriptive study.
What Is Descriptive Research?
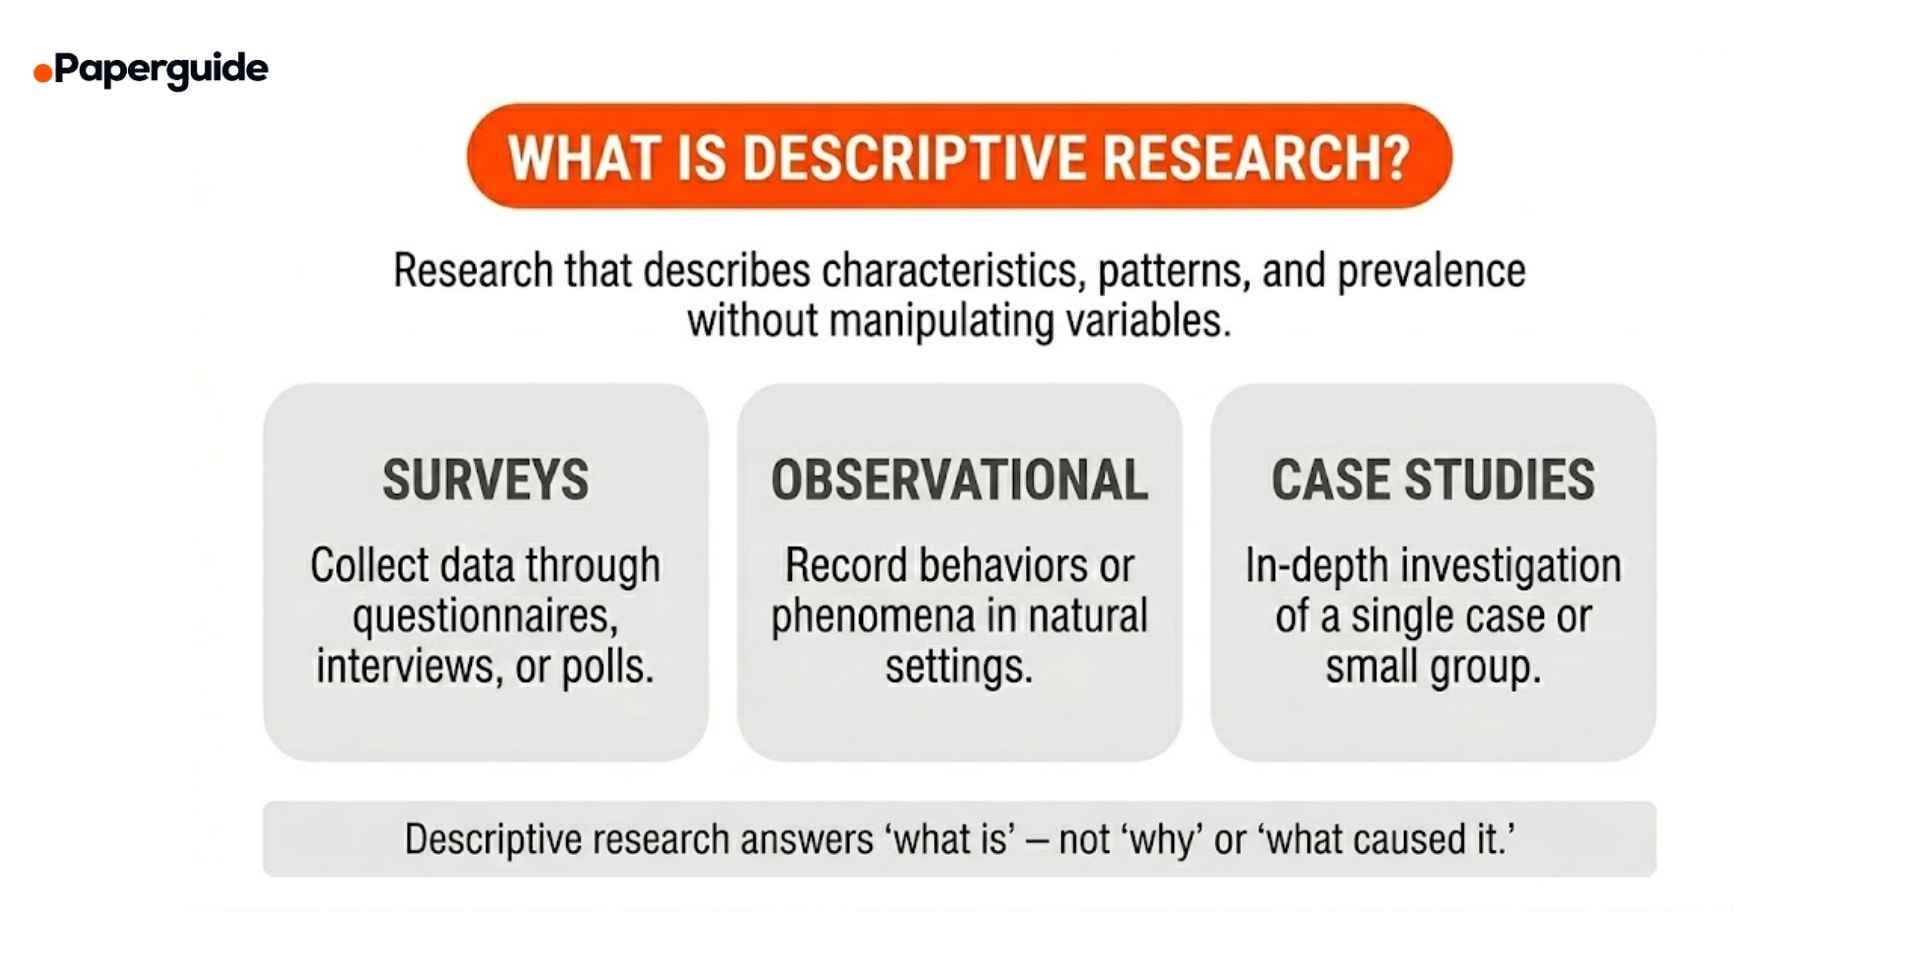
Descriptive research is a research design that systematically describes the characteristics, behaviors, or conditions of a population or phenomenon. It does not involve experimental manipulation, random assignment, or control groups. The researcher observes, measures, and reports what exists without intervening to change it.
Descriptive research answers questions like:
- What is the prevalence of burnout among emergency room nurses?
- How do consumers in different age groups use social media?
- What are the reading habits of undergraduate students?
- What percentage of small businesses adopted AI tools in 2025?
The defining characteristic of descriptive research is that it documents reality as it is. It does not test hypotheses about causal relationships, though it can generate hypotheses that are later tested through experimental or quasi-experimental designs.
Descriptive research is often the first step in a larger research program. Before testing whether an intervention reduces burnout, for example, a researcher must first describe how prevalent burnout is, which populations are most affected, and what factors are associated with it. Without this descriptive foundation, experimental research lacks context and direction.
Types of Descriptive Research Methods
Descriptive research uses three primary methods, each suited to different research questions and contexts.
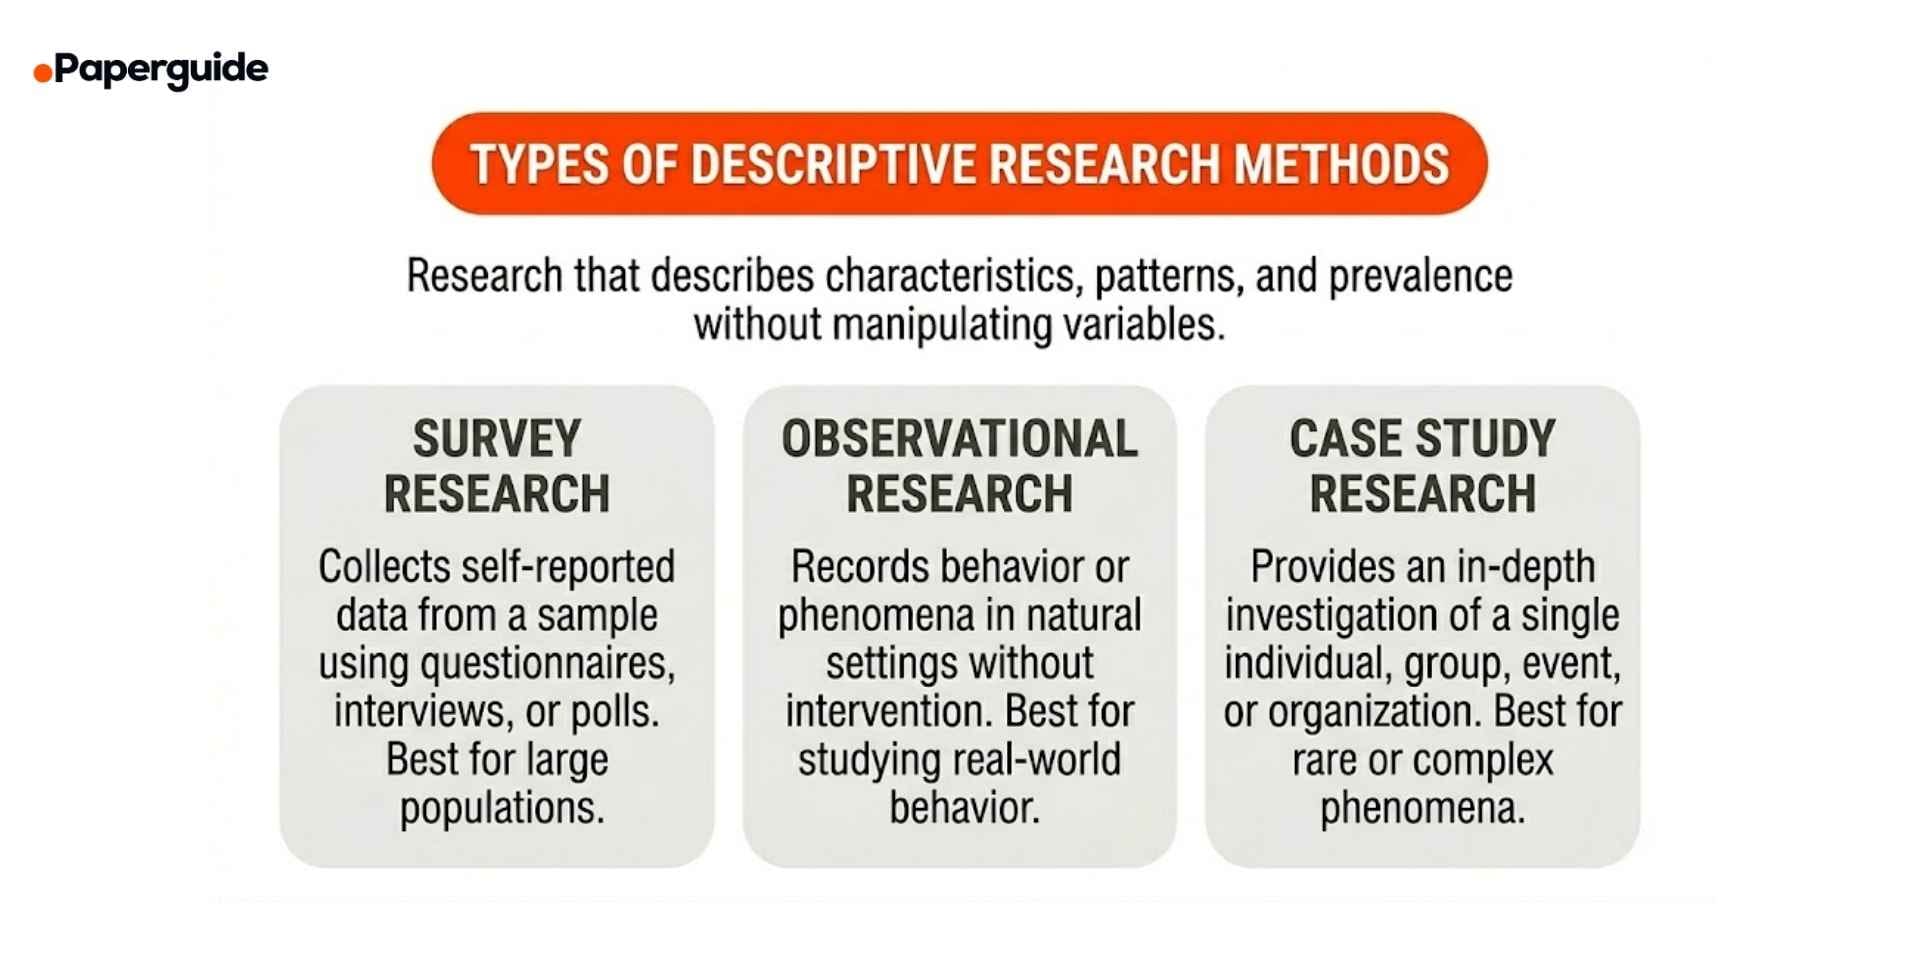
Survey Research
Survey research collects data from a sample of participants using structured questionnaires, interviews, or polls. It is the most common descriptive method and is used extensively in education, psychology, marketing, public health, and political science.
Surveys can be administered online, by phone, by mail, or in person. They collect quantitative data (closed-ended questions with numerical responses) or qualitative data (open-ended questions with text responses), or both.
Example: A university administers an annual survey to all enrolled students measuring satisfaction with academic advising, campus facilities, and financial aid services. The survey uses a 5-point Likert scale and collects responses from 4,200 students.
Strengths: Efficient for large populations. Standardized questions allow for statistical analysis. Can reach geographically dispersed participants through online administration.
Limitations: Subject to response bias (participants may answer in socially desirable ways). Low response rates can compromise representativeness. Self-reported data may not reflect actual behavior.
Observational Research
Observational research involves the researcher systematically watching, recording, and analyzing behaviors or phenomena in their natural setting without any intervention or manipulation.
Observation can be structured (using predefined categories and coding schemes) or unstructured (recording everything that occurs). The researcher can be a participant observer (involved in the setting) or a non-participant observer (watching from outside).
Example: A researcher observes classroom interactions in 20 elementary school classrooms over four weeks, recording how frequently teachers use positive reinforcement, corrective feedback, and neutral instructions. The observations follow a structured coding protocol with two trained observers.
Strengths: Captures actual behavior rather than self-reported behavior. High ecological validity because data is collected in natural settings. Useful when surveys are impractical (e.g., studying young children or non-verbal behavior).
Limitations: Time-consuming and labor-intensive. Observer presence may alter participant behavior (the Hawthorne effect). Inter-rater reliability must be established and maintained.
Case Study Research
Case study research provides a detailed, in-depth investigation of a single individual, group, organization, event, or phenomenon. It uses multiple data sources (interviews, documents, observations, archival records) to build a comprehensive understanding of the case.
Example: A researcher conducts a case study of a hospital that successfully reduced patient readmission rates by 40% over two years. The study examines the hospital's new discharge planning protocol through interviews with staff, analysis of patient records, and observation of discharge procedures.
Strengths: Provides rich, detailed, contextualized data. Valuable for studying rare, unique, or complex phenomena. Can generate hypotheses for future research.
Limitations: Findings cannot be generalized beyond the specific case. Subject to researcher bias in interpretation. Extremely time-intensive. Understanding how AI research assistant tools for scientific research support data organization can help case study researchers manage the large volumes of qualitative data these designs produce.
Descriptive vs Analytical Research: Key Differences
Descriptive and analytical (explanatory) research are often confused. The distinction is fundamental and determines what conclusions a study can draw.
| Criteria | Descriptive Research | Analytical Research |
|---|---|---|
| Purpose | Describes what exists | Explains why something exists or occurs |
| Research question | What is? How many? What are the characteristics? | Why does it happen? What causes it? |
| Variable manipulation | None | May manipulate variables or use statistical controls |
| Causation | Cannot establish cause and effect | Aims to establish causal relationships |
| Common methods | Surveys, observations, case studies | Experiments, quasi-experiments, regression analysis |
| Output | Frequencies, percentages, means, patterns | Effect sizes, odds ratios, causal models |
Descriptive research tells you what the landscape looks like. Analytical research tells you why the landscape looks that way. Both are essential, but confusing one for the other is a common and serious methodological error.

When to Use Descriptive Research
Descriptive research is the right choice in specific situations. Understanding when it is appropriate prevents both underuse and misuse.
Use descriptive research when:
- You need to document the prevalence or frequency of a phenomenon (e.g., "What percentage of teachers use AI tools in the classroom?").
- You want to describe the characteristics of a population (e.g., "What are the demographics of freelance workers in the gig economy?").
- You are exploring a new topic where little prior research exists and need baseline data before designing an experimental study.
- You need to identify patterns, trends, or associations that can generate hypotheses for future causal research.
- Ethical or practical constraints prevent you from manipulating variables (e.g., you cannot experimentally expose people to poverty to study its effects).
Do not use descriptive research when:
- Your research question asks about causation ("Does X cause Y?"). Use an experimental or quasi-experimental design instead.
- You need to test the effectiveness of an intervention. Descriptive research can document what exists before and after an intervention, but it cannot attribute changes to the intervention without a control group.
- You need to predict outcomes. Descriptive research identifies what is, but predictive research requires analytical or inferential designs.
How to Design a Descriptive Study (Step-by-Step)
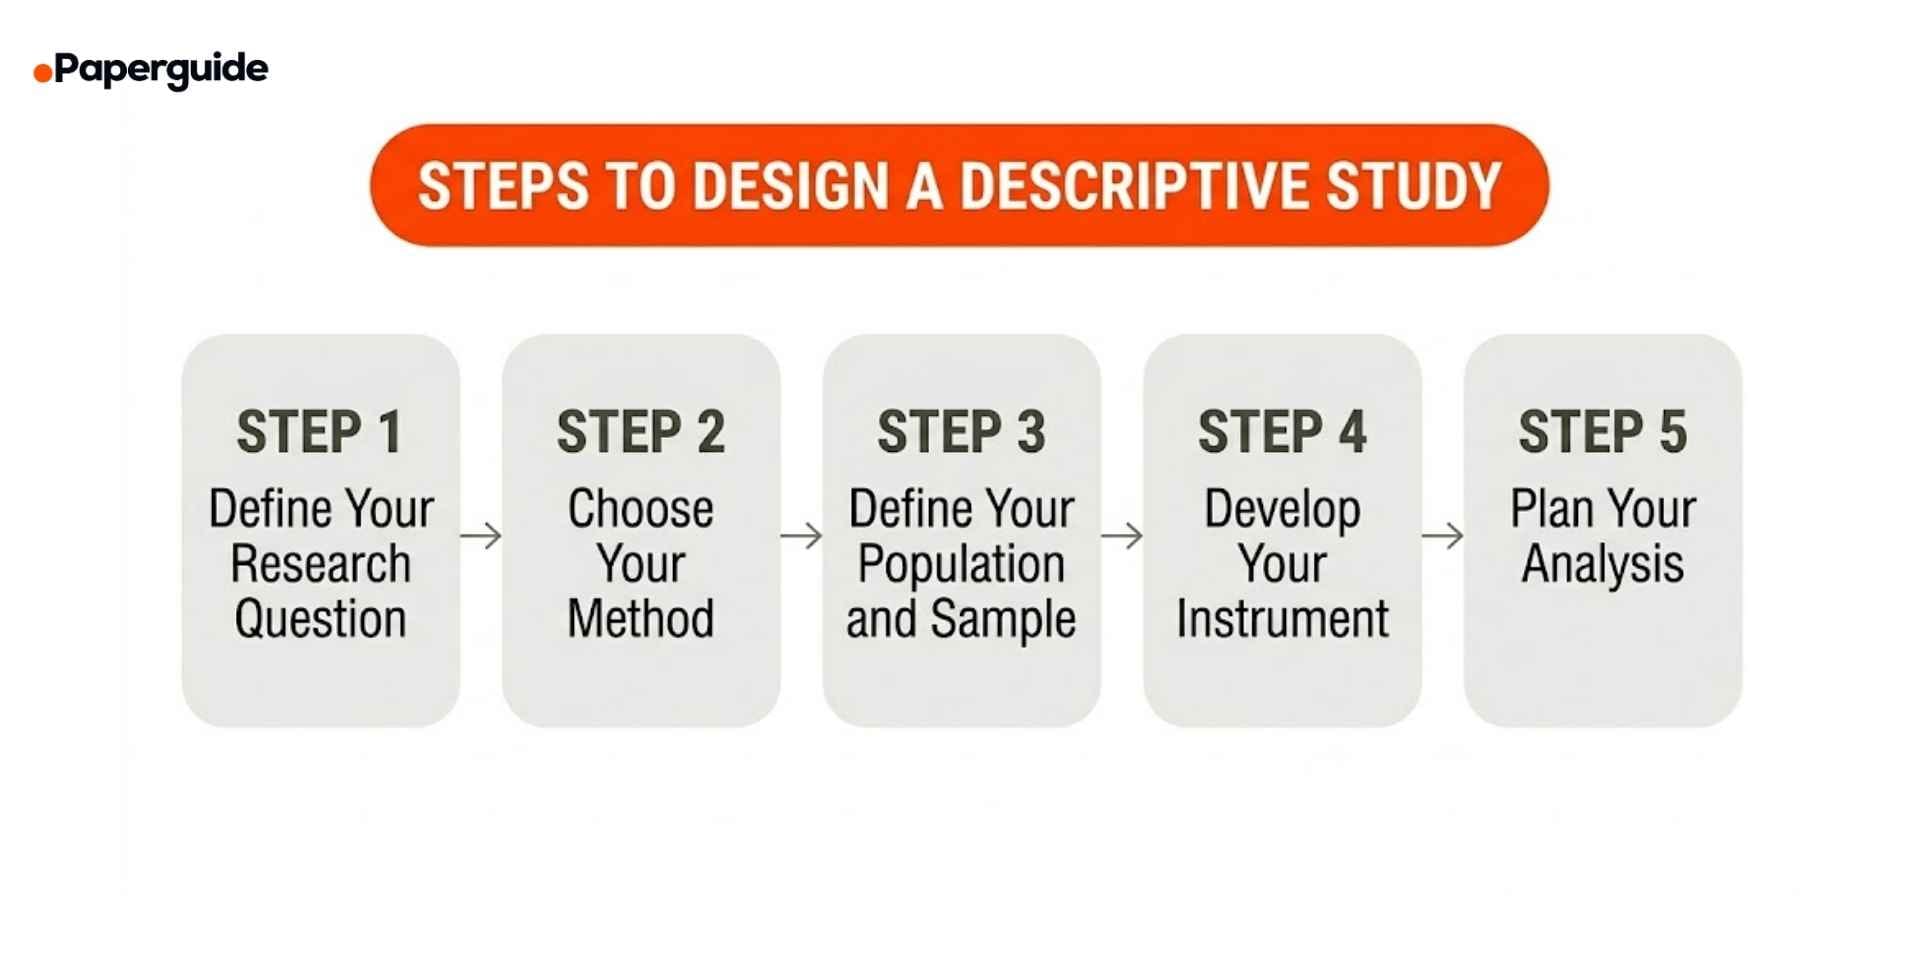
Step 1: Define Your Research Question
Your research question must be descriptive in nature. It should ask about characteristics, prevalence, distribution, or patterns rather than causation.
Good descriptive questions:
- "What is the prevalence of remote work among Fortune 500 employees in 2026?"
- "What study strategies do high-performing medical students report using?"
- "How do parents of children with autism describe their experience navigating the school system?"
Step 2: Choose Your Descriptive Method
Match the method to the question:
- Survey if you need data from a large number of participants and the information is best collected through self-report.
- Observation if you need to document actual behavior rather than self-reported behavior.
- Case study if you are investigating a unique, rare, or particularly complex phenomenon in depth.
Step 3: Define Your Population and Sample
Clearly identify your target population (who you want your findings to describe) and your sampling strategy. For surveys, determine your sample size. For observations, define the setting, time frame, and units of analysis. For case studies, justify your case selection.
A 2024 analysis in PMC emphasized that poor sample definition is one of the most common weaknesses in cross-sectional descriptive studies, often making it unclear whether findings apply to the intended population. [3]
Step 4: Develop Your Data Collection Instrument
Design or select your survey questionnaire, observation protocol, or case study interview guide. If using an existing validated instrument, document its reliability and validity evidence. If developing a new instrument, pilot test it with a small sample first.
Step 5: Plan Your Analysis
Descriptive research typically uses descriptive statistics: frequencies, percentages, means, standard deviations, and cross-tabulations. For qualitative descriptive designs, plan your coding and thematic analysis approach. A 2025 step-by-step guide in the Journal of Advanced Nursing provided a worked example demonstrating that qualitative descriptive design requires the same methodological rigor as other qualitative approaches, including transparent coding procedures, member checking, and reflexivity documentation. [4]
Examples Across Disciplines
Example 1: Public Health (Cross-Sectional Survey)
Research question: "What is the prevalence of food insecurity among college students at public universities?"
- Method: Cross-sectional online survey administered to 3,500 students across 12 public universities
- Instrument: USDA Household Food Security Survey Module (validated, 18-item)
- Analysis: Prevalence rates calculated by demographic subgroups (income, year of study, housing status)
- Finding: 34% of respondents reported some level of food insecurity, with first-generation students at significantly higher rates
Example 2: Education (Structured Observation)
Research question: "How do kindergarten teachers integrate technology into daily instruction?"
- Method: Structured observation of 25 kindergarten classrooms over three weeks
- Instrument: Custom observation protocol recording type of technology, duration of use, instructional purpose, and student engagement indicators. Two trained observers with inter-rater reliability of kappa = .82
- Analysis: Frequency counts and descriptive statistics for each technology type and instructional purpose
- Finding: Teachers used technology an average of 22 minutes per day, primarily for whole-class instruction rather than individualized learning
Example 3: Business (Survey + Secondary Data)
Research question: "What are the characteristics and challenges of women-owned startups in the technology sector?"
- Method: Online survey of 600 women founders combined with analysis of publicly available funding data
- Instrument: Custom 35-item questionnaire covering demographics, funding sources, growth metrics, and perceived barriers
- Analysis: Descriptive statistics, cross-tabulations by company stage and funding status
- Finding: 72% of respondents reported difficulty accessing venture capital, with bootstrapped founders reporting faster time-to-profitability than venture-backed founders
Example 4: Psychology (Case Study)
Research question: "How does a long-term care facility implement person-centered dementia care?"
- Method: Single-site case study over six months
- Data sources: 15 staff interviews, 40 hours of observation, facility policy documents, family satisfaction surveys
- Analysis: Thematic analysis of interviews and observations; triangulation across data sources
- Finding: Three key themes emerged: institutional resistance to change, staff-initiated workarounds, and the role of family advocacy in driving adoption
Common Mistakes and How to Fix Them
Descriptive research mistakes are common because the design appears simple, leading researchers to underestimate the rigor required.
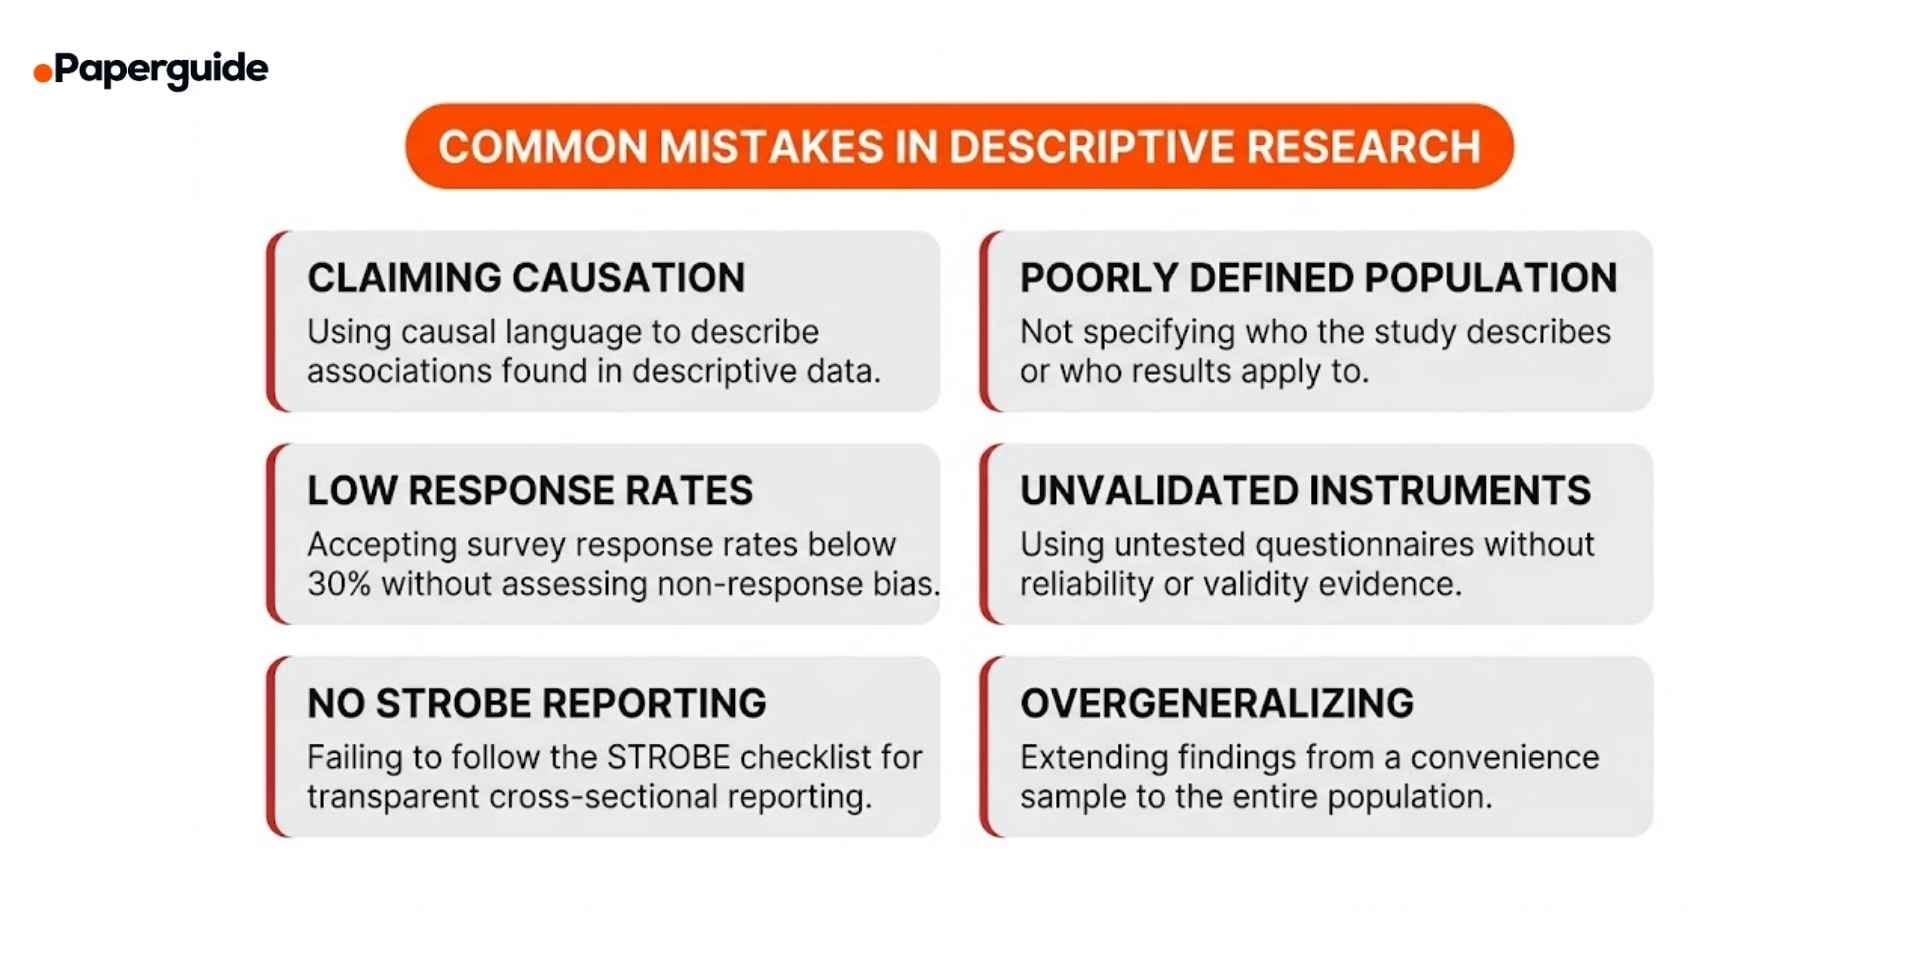
Mistake 1: Claiming Causation From Descriptive Data
Error: Writing "social media use causes anxiety" based on a cross-sectional survey that found a correlation between the two variables.
Fix: Use descriptive language that matches the design. Say "social media use was associated with higher anxiety scores" or "participants who reported more social media use also reported higher anxiety." Reserve causal language for experimental designs.
Mistake 2: Poorly Defined Target Population
Error: Stating "we surveyed college students" without specifying the institution, enrollment criteria, or demographics of the target population.
Fix: Define exactly who your study describes. Specify the population, inclusion and exclusion criteria, and the sampling method. This allows readers to evaluate whether the sample represents the population of interest.
Mistake 3: Ignoring Non-Response Bias
Error: Accepting a 15% survey response rate without assessing whether non-respondents differ systematically from respondents.
Fix: Report your response rate explicitly. If it is below 50%, conduct a non-response analysis comparing available characteristics of respondents and non-respondents. Acknowledge low response rates as a limitation. Using best AI research assistant tools can help you locate published examples of how other researchers in your field have handled non-response bias.
Mistake 4: Using Unvalidated Instruments
Error: Creating a new survey for a study without pilot testing, expert review, or reliability assessment.
Fix: Use established, validated instruments whenever possible. If developing a new instrument, conduct content validation through expert review, pilot test with a small sample, and calculate reliability (Cronbach's alpha for internal consistency).
Mistake 5: Not Following STROBE Reporting Standards
Error: Publishing a cross-sectional study without following the STROBE (Strengthening the Reporting of Observational Studies in Epidemiology) checklist, leaving key methodological details unreported.
Fix: Use the 22-item STROBE checklist for cross-sectional studies to ensure your report includes all essential information about design, participants, variables, data sources, bias, sample size, statistical methods, and results. [2]
Mistake 6: Overgeneralizing From Convenience Samples
Error: Surveying 200 students at one university and concluding that "college students prefer online learning" without acknowledging the sample limitations.
Fix: Fix: Limit your conclusions to the sample studied. If using a convenience sample, state clearly that findings may not generalize to other populations or institutions. Researchers choose convenience sampling, a non-probability sampling method, typically for practical reasons.
Descriptive Study Design Checklist
Use this checklist to verify your descriptive study design before beginning data collection.
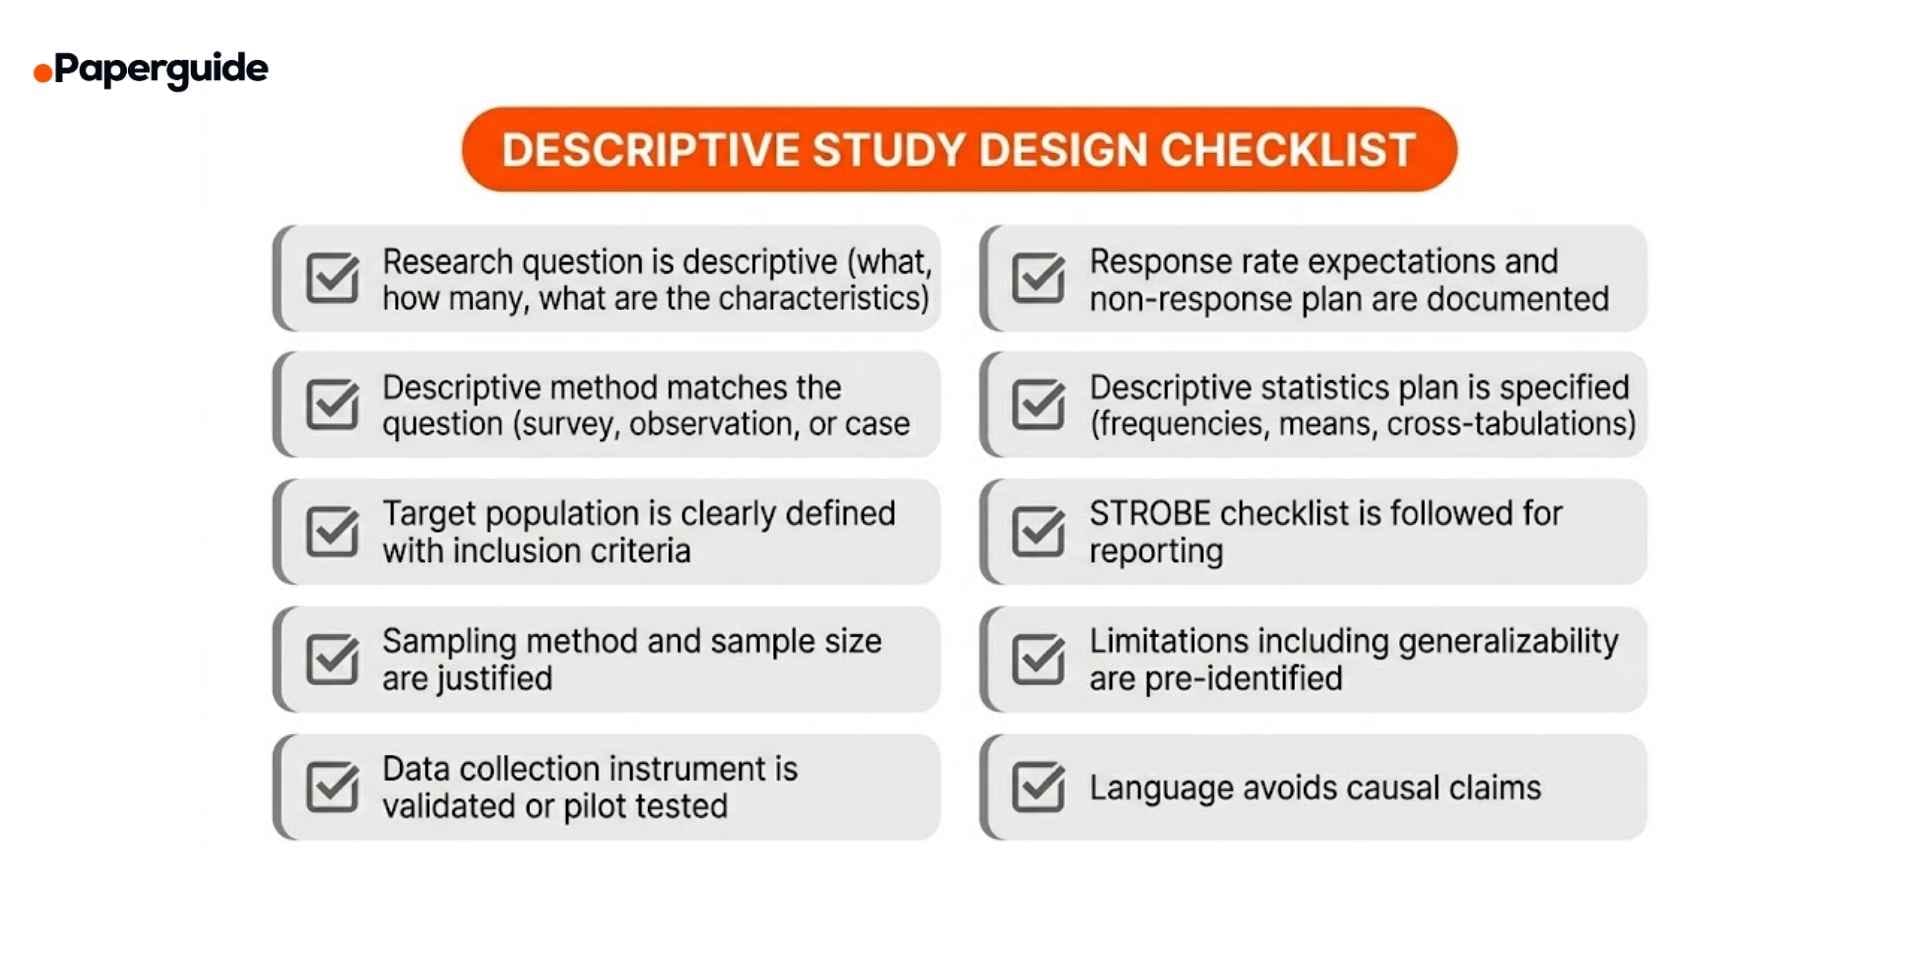
- [ ] Research question is descriptive. The question asks about characteristics, prevalence, or patterns, not causation.
- [ ] Descriptive method matches the question. Survey, observation, or case study is selected based on the type of data needed.
- [ ] Target population is clearly defined. Inclusion and exclusion criteria are specified.
- [ ] Sampling method and sample size are justified. The sampling strategy is appropriate and the sample size is adequate for the analysis planned.
- [ ] Data collection instrument is validated or pilot tested. Reliability and validity evidence is documented.
- [ ] Response rate expectations and non-response plan are documented. A plan exists for handling low response rates.
- [ ] Descriptive statistics plan is specified. The analysis approach (frequencies, means, cross-tabulations, thematic analysis) is determined before data collection.
- [ ] STROBE checklist is followed for reporting. All 22 items are addressed in the manuscript.
- [ ] Limitations including generalizability are pre-identified. Known constraints of the design and sample are documented.
- [ ] Language avoids causal claims. All conclusions use associational rather than causal language.
Descriptive Study Template
Use this template to plan your descriptive study. Replace the bracketed sections with your own content.
Research Question: [Your descriptive research question]
Method: [Survey / Observation / Case Study]
Target Population: [Who or what you want to describe]
Sample: [Sample size, sampling method, inclusion criteria]
Instrument: [Questionnaire, observation protocol, or interview guide — validated or new]
Data Collection Procedure: [How, when, and where data will be collected]
Analysis Plan: [Descriptive statistics, thematic analysis, or both]
Reporting Standard: [STROBE for cross-sectional; COREQ for qualitative]
Known Limitations: [Generalizability, response bias, observer effects]
Filled Example:
Research Question: "What are the mental health support preferences of first-year graduate students at research universities?"
Method: Cross-sectional online survey
Target Population: First-year graduate students enrolled in research-intensive (R1) universities in the United States
Sample: 1,200 students from 8 R1 universities, recruited via institutional email lists. Stratified by discipline (STEM, humanities, social sciences, professional programs).
Instrument: Modified version of the Counseling Center Assessment of Psychological Symptoms (CCAPS-34), plus 10 additional items on preferred support formats (individual therapy, group therapy, peer support, online resources, crisis hotline). Pilot tested with 40 students; Cronbach's alpha = .87.
Data Collection Procedure: Survey distributed via Qualtrics in weeks 8–10 of the fall semester. Two reminder emails sent at one-week intervals. Estimated response rate: 35–40%.
Analysis Plan: Descriptive statistics (frequencies, means, standard deviations) for each support preference by demographic subgroup. Cross-tabulations by discipline and gender. No inferential tests — the goal is to describe preferences, not test differences.
Reporting Standard: STROBE checklist for cross-sectional studies.
Known Limitations: Convenience sampling within selected universities. Self-reported preferences may not reflect actual service use. Response bias likely (students with stronger mental health opinions may be more likely to respond).
Validate This With Papers (2 Minutes)
Before finalizing your descriptive study design, check how published studies in your field have approached similar descriptive questions. This prevents common oversights and strengthens your methodology.
Step 1: Search for recent descriptive studies that investigated a similar population or phenomenon. Focus on their method choice, sampling strategy, and how they reported limitations.
Step 2: Open two or three relevant papers. Look at the instruments they used, their response rates, and how they handled non-response bias or generalizability limitations. Reviewing AI essay writing tools can help you efficiently compare methodology sections and identify common reporting patterns across published descriptive studies.
Step 3: Use a Paragraph Summarizer to extract key methodology details from each paper. Compare their design decisions and acknowledged limitations with yours.
This takes about two minutes and ensures your descriptive study meets the standards expected in your field.
Conclusion
Descriptive research is the most common and most foundational research design across disciplines. It documents what exists, measures prevalence, identifies patterns, and provides the baseline data that experimental and analytical research builds upon. The three main methods surveys, observational studies, and case studies each serve different purposes, and the right choice depends on the research question, the type of data needed, and practical constraints. Descriptive research is not inherently weaker than experimental research; it serves a different and equally necessary function in the research ecosystem.
The most common problems with descriptive research stem from underestimating its methodological requirements. Claiming causation from descriptive data, using unvalidated instruments, ignoring non-response bias, and overgeneralizing from convenience samples all weaken studies that could otherwise provide valuable evidence. Before collecting any data, define your population clearly, select or validate your instrument, plan your descriptive statistics, and follow the STROBE checklist for reporting. Rigorous descriptive research produces the evidence base that every other type of research depends on.
Frequently Asked Questions
What is descriptive research?
Descriptive research is a research design that systematically describes the characteristics, behaviors, or conditions of a population or phenomenon without manipulating any variables. It answers "what is" rather than "why" or "what caused it." Common methods include surveys, observational studies, and case studies.
What is the difference between descriptive and experimental research?
Descriptive research observes and documents what exists without intervention. Experimental research manipulates one or more variables to test cause-and-effect relationships. Descriptive research can identify associations but cannot establish causation. Experimental research can establish causation but requires control groups and random assignment.
When should I use descriptive research?
Use descriptive research when you need to document prevalence, describe characteristics of a population, explore a new topic, or generate hypotheses for future experimental studies. It is also appropriate when ethical or practical constraints prevent you from manipulating variables.
What are the three types of descriptive research methods?
The three main types are survey research (collecting self-reported data through questionnaires or interviews), observational research (systematically recording behaviors in natural settings), and case study research (in-depth investigation of a single case or small group using multiple data sources).
Can descriptive research be qualitative?
Yes. Qualitative descriptive research uses methods like interviews, focus groups, and open-ended surveys to describe experiences, perceptions, and meanings in participants' own words. It follows the same principles of rigorous design, transparent reporting, and systematic analysis.
What is the STROBE checklist?
STROBE (Strengthening the Reporting of Observational Studies in Epidemiology) is a 22-item checklist that specifies the essential information that should be reported in cross-sectional, cohort, and case-control studies. It covers study design, setting, participants, variables, data sources, bias, sample size, statistical methods, and results.
Can descriptive research establish causation?
No. Descriptive research can identify associations and correlations between variables, but it cannot determine that one variable caused a change in another. Establishing causation requires an experimental or quasi-experimental design with manipulation, control, and ideally random assignment.
References
- Christie, A.P. et al. "Quantifying and addressing the prevalence and bias of study designs in the environmental and social sciences." Nature Communications, 11, 6377, 2020.
- Capili, B. "Cross-Sectional Studies: Strengths, Weaknesses, and Recommendations." Chest, 158(1), S65–S71, 2020.
- Pérez-Guerrero, E.E. et al. "Methodological and Statistical Considerations for Cross-Sectional, Case–Control, and Cohort Studies."Journal of Clinical Medicine,, 13(14), 2024.
- Villamin, P. et al. "A Worked Example of Qualitative Descriptive Design: A Step-by-Step Guide for Novice and Early Career Researchers." Journal of Advanced Nursing, 2025.
- Aggarwal, R. & Ranganathan, P.. "Study designs: Part 2 – Descriptive studies." Perspectives in Clinical Research,, 10 (1), 2019.