
Effect Size Explained: Cohen's d, Hedges' g, OR + RR Guide


Effect size is a quantitative measure of the magnitude of a phenomenon, relationship, or difference observed in a study. While statistical significance tells you whether an effect exists (whether the null hypothesis can be rejected), effect size tells you how large that effect is and whether it matters in practice. A study may yield a statistically significant p-value even when the actual effect is negligible, or it may produce a non-significant p-value despite a meaningful effect, simply because the study lacked sufficient power to detect it. Without reporting effect sizes, readers cannot judge the practical importance of research findings. [1]
The choice of which effect size measure to use depends on the type of data, the study design, and the research question. Cohen's d and Hedges' g quantify the standardized difference between two group means and are used when the outcome is continuous. Odds ratios and relative risk quantify the association between an exposure and a binary outcome and are used when the outcome is categorical (yes/no, event/no event). Understanding when to use each measure, how to calculate it, how to interpret it, and how to convert between measures is essential for researchers conducting primary studies, systematic reviews, and meta-analyses. This guide explains the four most common effect size measures, walks through their calculation with worked examples, and provides a decision framework for choosing the right one. [3]
Key Takeaways
- Effect size measures the magnitude of an effect, not just whether it is statistically significant, and should be reported in every quantitative study
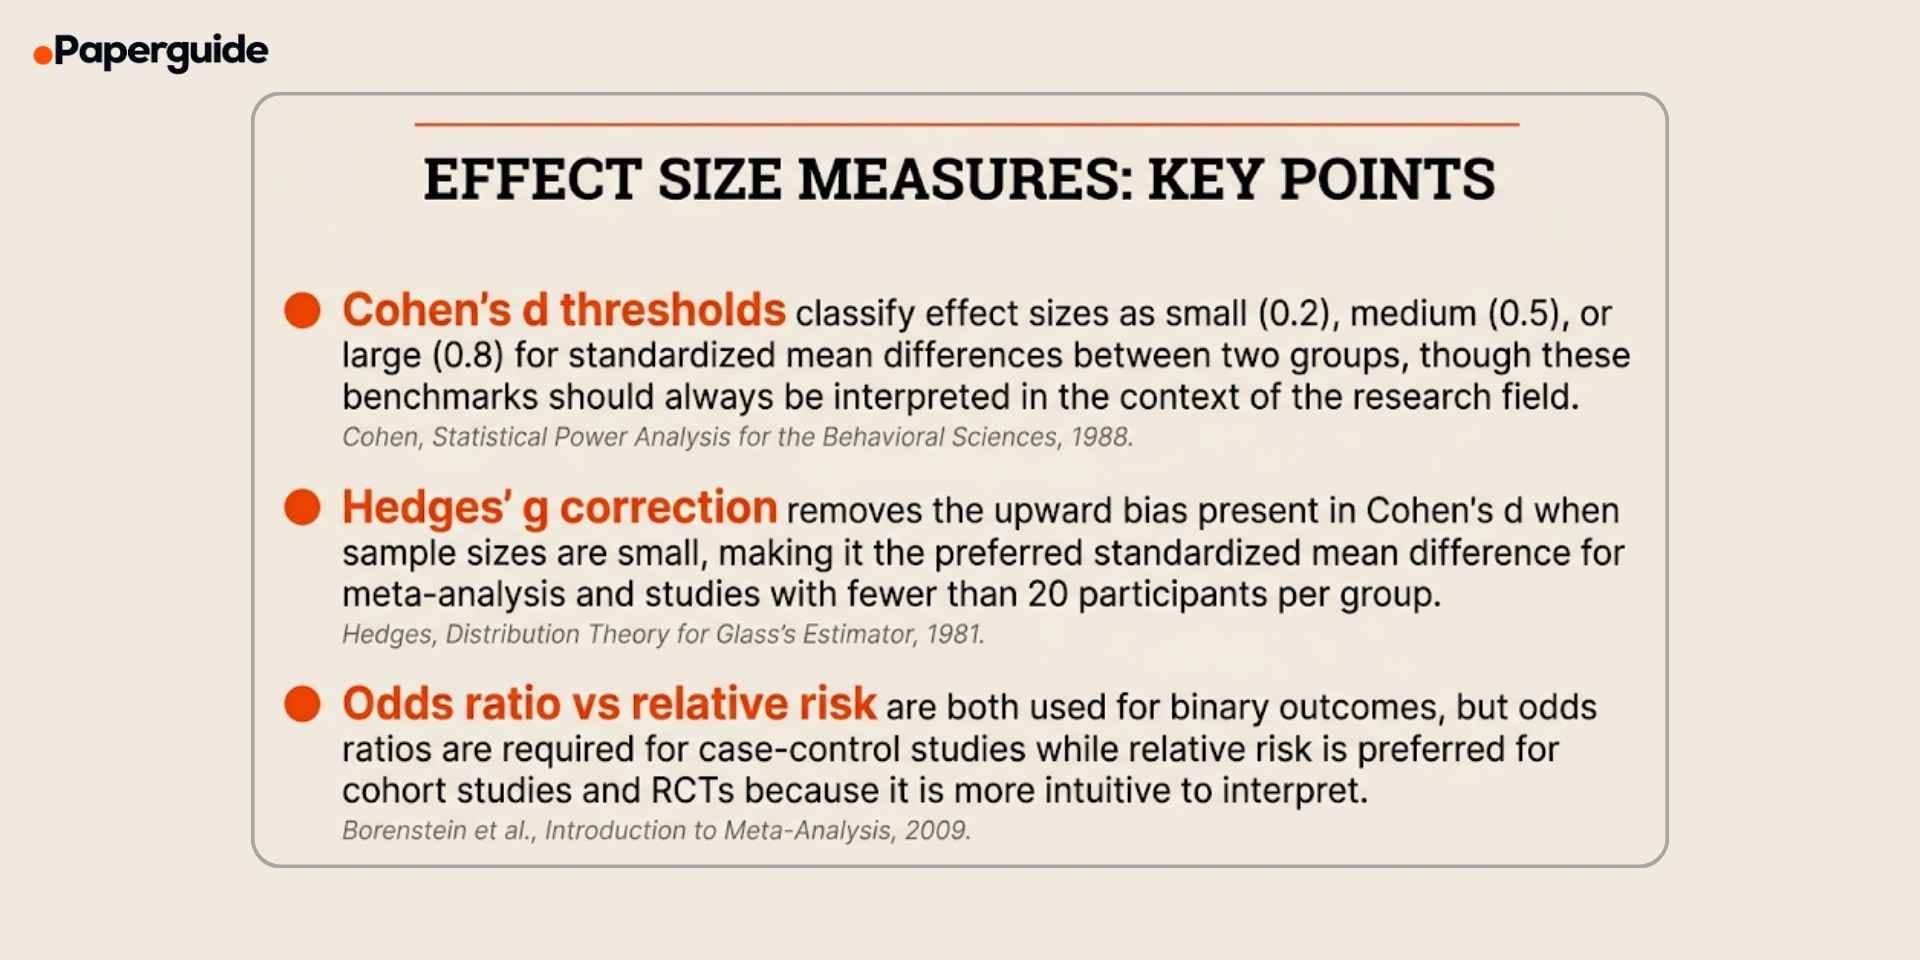
- Cohen's d is the standardized mean difference between two groups, with conventional thresholds of 0.2 (small), 0.5 (medium), and 0.8 (large)
- Hedges' g applies a correction factor to Cohen's d that removes upward bias in small samples (typically fewer than 20 per group), making it the standard for meta-analysis
- Odds ratios are required for case-control studies and logistic regression, while relative risk is preferred for cohort studies and RCTs because it directly estimates probability
- Effect sizes can be converted between families (d to r, OR to d) using standard formulas, enabling comparison and pooling across studies that use different measures.
What Is Effect Size?
Effect size is a standardized, quantitative measure that captures the magnitude or strength of a phenomenon observed in data. It answers the question "how big is the effect?" rather than "is there an effect?" and provides the information needed to evaluate whether a statistically significant result has practical, clinical, or theoretical importance. [1]
.jpg)
Effect sizes fall into several families depending on the type of data and comparison. The d-family (Cohen's d, Hedges' g, Glass's delta) measures the standardized difference between group means. The r-family (Pearson's r, eta squared, partial eta squared) measures the strength of association or the proportion of variance explained. The odds ratio and relative risk families measure the association between an exposure and a binary outcome.
The reason effect size matters goes beyond statistical reporting conventions. A large randomized trial with 10,000 participants might detect a statistically significant (p < 0.001) difference between treatment and control groups, but if the effect size is d = 0.05, the actual difference is negligible. Conversely, a pilot study with 30 participants might produce a non-significant p-value (p = 0.08) but reveal a large effect size of d = 0.70 that would be clinically meaningful if confirmed in a larger trial. Without effect size, statistical significance alone can mislead both researchers and practitioners. Understanding how different research methods and quantitative approaches produce different types of data helps researchers choose the right effect size measure from the start. [4]
Cohen's d vs Hedges' g vs Odds Ratio vs Relative Risk (Comparison)
Each effect size measure is designed for a specific data type and study design. Using the wrong measure produces results that are either uninterpretable or misleading.
| Feature | Cohen's d | Hedges' g | Odds Ratio (OR) | Relative Risk (RR) |
|---|---|---|---|---|
| Data type | Continuous | Continuous | Binary (2x2 table) | Binary (2x2 table) |
| Comparison | Two group means | Two group means | Exposure-outcome association | Exposure-outcome association |
| Scale | Standardized (SD units) | Standardized (SD units) | Ratio (0 to infinity) | Ratio (0 to infinity) |
| Null value | 0 | 0 | 1.0 | 1.0 |
| Small sample correction | No | Yes (J correction) | Not applicable | Not applicable |
| Best for | RCTs, experiments with adequate n | Meta-analysis, small sample studies | Case-control studies, logistic regression | Cohort studies, RCTs |
| Interpretation | 0.2 small, 0.5 medium, 0.8 large | Same as Cohen's d | OR > 1 increased odds, OR < 1 decreased odds | RR > 1 increased risk, RR < 1 decreased risk |
| Key limitation | Biased upward in small samples | Slightly more conservative than d | Overestimates effect when outcome is common (>10%) | Cannot be calculated from case-control designs |
Cohen's d and Hedges' g are both standardized mean differences, and the choice between them depends primarily on sample size. For studies with 20 or more participants per group, Cohen's d and Hedges' g produce nearly identical values. For smaller samples, Hedges' g is preferred because it corrects for the slight upward bias inherent in Cohen's d. In meta-analysis, Hedges' g is the standard choice regardless of individual study sample sizes because it provides unbiased estimates for pooling. [2] [3]
The odds ratio and relative risk both describe the association between an exposure and a binary outcome, but they are not interchangeable. Relative risk directly estimates how much more likely an outcome is in the exposed group compared to the unexposed group, making it more intuitive. However, relative risk cannot be calculated from case-control studies (where the outcome prevalence is fixed by design), so the odds ratio is required in those designs. When the outcome is rare (less than 10% prevalence), the odds ratio approximates the relative risk. When the outcome is common, the odds ratio overestimates the strength of the association compared to the relative risk. [3]
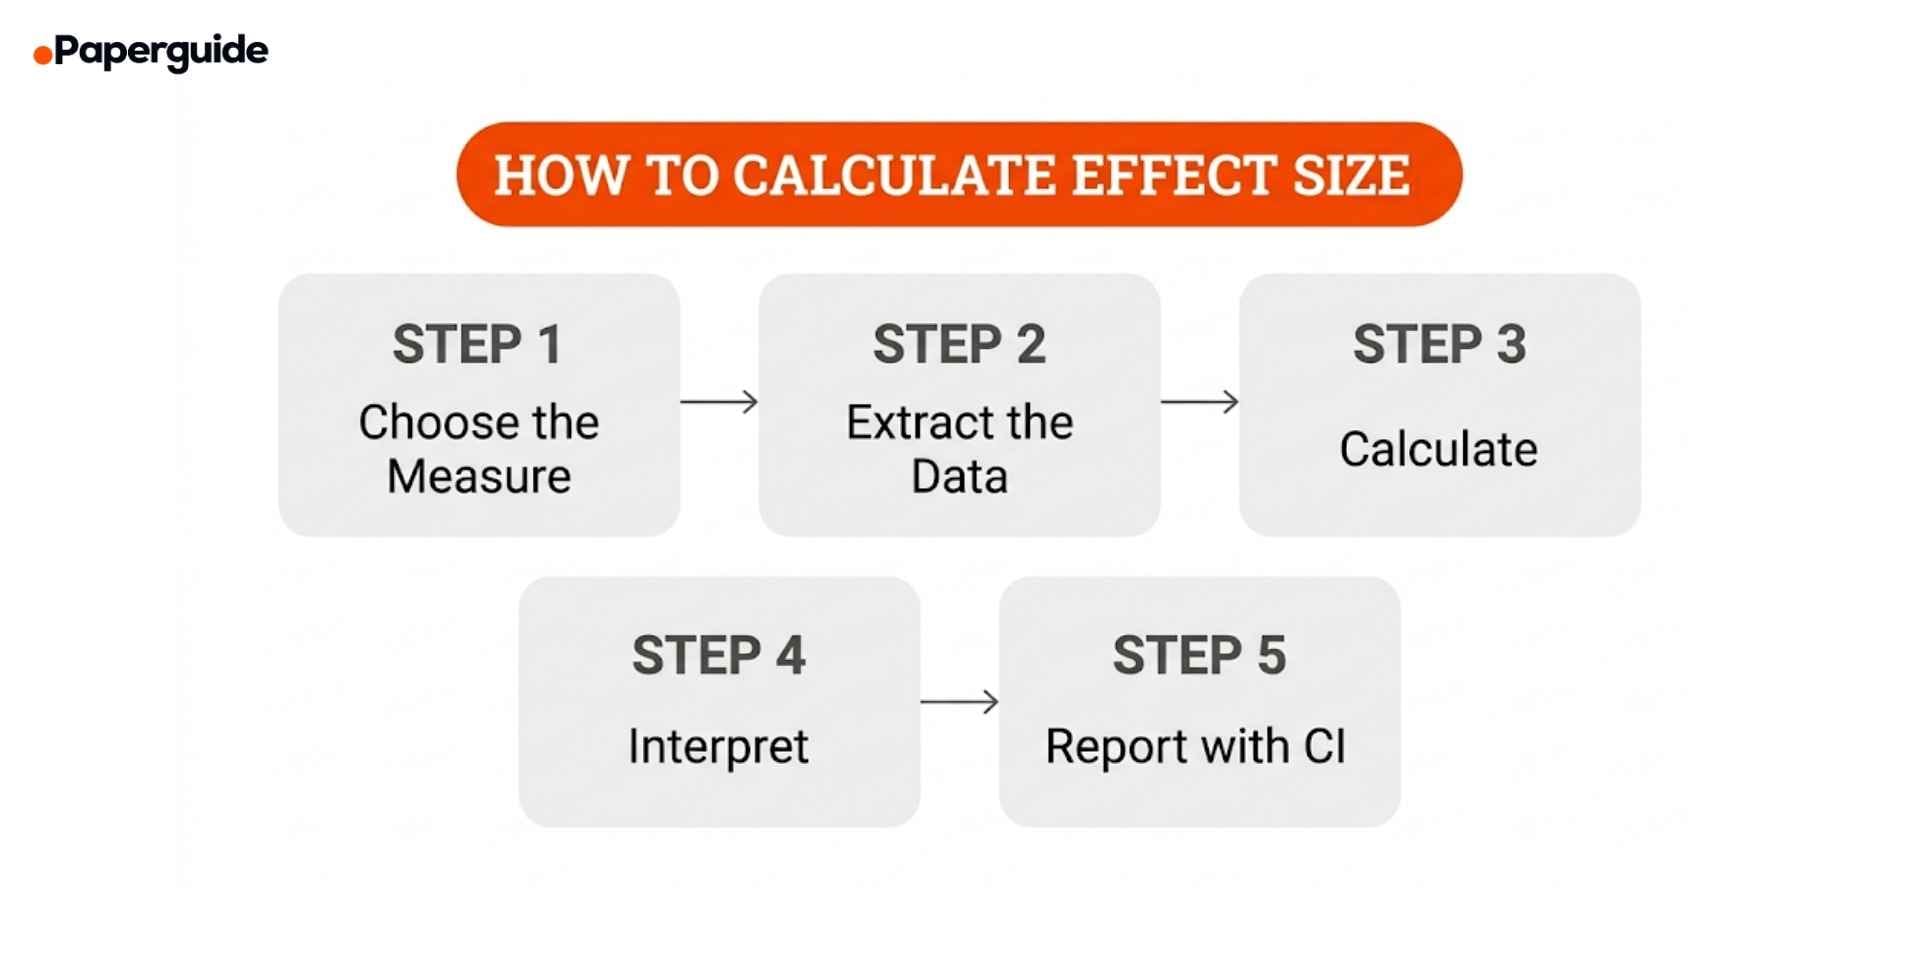
How to Calculate and Interpret Effect Sizes (5 Steps)
The five steps below cover the process from selecting the right measure through reporting your results. The specific formulas differ by measure, but the workflow is consistent.
Step 1: Choose the Right Effect Size Measure
Start by identifying the type of outcome variable and the study design, then match them to the appropriate effect size measure.
For continuous outcomes (scores, measurements, scales): Use Cohen's d for individual studies with adequate sample sizes (n > 20 per group). Use Hedges' g for studies with small samples or when pooling effect sizes in meta-analysis. Use Glass's delta when the two groups have unequal variances and you want to standardize by the control group's standard deviation only.
For binary outcomes (event/no event, yes/no): Use the odds ratio for case-control studies, logistic regression output, or when the outcome prevalence exceeds 10%. Use relative risk for cohort studies and randomized controlled trials where the outcome incidence can be directly estimated.
For correlational data: Use Pearson's r for the association between two continuous variables. Use eta squared or partial eta squared for the proportion of variance explained in ANOVA designs.
Step 2: Extract the Required Data
Each effect size formula requires specific summary statistics. Extract these from the study's results section, tables, or supplementary materials. [4]
For Cohen's d and Hedges' g: You need the mean, standard deviation, and sample size for each group. If these are not directly reported, Cohen's d can be calculated from a t-statistic, F-statistic, or p-value with sample sizes using conversion formulas.
For odds ratio: You need the 2x2 contingency table (counts of events and non-events in each group). If only percentages are reported, convert them to counts using the group sample sizes.
For relative risk: You need the same 2x2 table or the event rates (incidence) in each group.
Record all extracted values in a structured spreadsheet. Include the study identifier, outcome, time point, and any notes about how the data were derived. Researchers who compare analytical tools for evidence synthesis will find that dedicated extraction forms significantly reduce errors during this step.
Step 3: Calculate the Effect Size
Apply the appropriate formula to your extracted data. [1] [3]
Cohen's d formula:
d = (M1 minus M2) / Sp
Where M1 is the mean of group 1, M2 is the mean of group 2, and Sp is the pooled standard deviation calculated as: Sp = square root of [(n1 minus 1) times S1 squared plus (n2 minus 1) times S2 squared, all divided by (n1 plus n2 minus 2)].
Hedges' g formula:
g = d times J
Where J is the correction factor: J = 1 minus [3 / (4 times (n1 plus n2) minus 9)]. This correction reduces the slight positive bias in Cohen's d for small samples.
Odds ratio formula:
OR = (a times d) / (b times c)
Where a = events in exposed group, b = non-events in exposed group, c = events in unexposed group, d = non-events in unexposed group (from the 2x2 table).
Relative risk formula:
RR = [a / (a plus b)] / [c / (c plus d)]
Where a/(a+b) is the event rate in the exposed group and c/(c+d) is the event rate in the unexposed group.
Step 4: Interpret the Effect Size
Interpretation depends on the measure and the research context. Cohen (1988) proposed conventional benchmarks for d, but these should be used as rough guides rather than rigid cutoffs. [1]
Cohen's d and Hedges' g interpretation:
Small: d = 0.2 (the difference between groups is about one-fifth of a standard deviation). Medium: d = 0.5 (the difference is half a standard deviation). Large: d = 0.8 (the difference is four-fifths of a standard deviation).
However, these benchmarks are arbitrary and field-dependent. In clinical research, a d of 0.3 might represent a meaningful treatment benefit. In educational interventions, a d of 0.4 is often considered practically significant. Always interpret effect sizes in the context of your specific field and the minimum clinically important difference for your outcome. [4]
Odds ratio interpretation:
OR = 1.0 means no association. OR > 1.0 means the exposure is associated with increased odds of the outcome. OR < 1.0 means the exposure is associated with decreased odds. An OR of 2.5 means the odds of the outcome are 2.5 times higher in the exposed group. Small: OR = 1.5, medium: OR = 2.5, large: OR = 4.3 (these correspond approximately to d = 0.2, 0.5, and 0.8 using the conversion formula).
Relative risk interpretation:
RR = 1.0 means no difference in risk. RR > 1.0 means increased risk. RR < 1.0 means decreased risk. An RR of 1.5 means the event is 50% more likely in the exposed group. Unlike the odds ratio, relative risk can be directly converted to statements about probability.
Step 5: Report the Effect Size with a Confidence Interval
Always report the point estimate and its 95% confidence interval. The CI communicates the precision of your effect size estimate and provides more information than the point estimate alone. [4][5]
Reporting format for Cohen's d and Hedges' g: "The intervention produced a large effect on anxiety symptoms (d = 0.82, 95% CI [0.45, 1.19])."
Reporting format for odds ratio: "Exposure to the risk factor was associated with significantly increased odds of the outcome (OR = 2.34, 95% CI [1.56, 3.51])."
Reporting format for relative risk: "Participants in the treatment group were 40% less likely to experience the adverse event (RR = 0.60, 95% CI [0.42, 0.86])."
If the confidence interval for d includes 0, or the confidence interval for OR or RR includes 1.0, the effect is not statistically significant at the alpha level used. Report this finding transparently, noting that the study may have been 'underpowered' to detect a meaningful effect.

Effect Size Examples (Worked Through)
Below are four examples showing how to calculate and interpret each measure with real numbers.
Example 1: Cohen's d for a Two-Group Experiment
Study: An RCT comparing a new teaching method (n = 45, mean exam score = 78.3, SD = 12.1) versus traditional instruction (n = 43, mean = 71.6, SD = 11.8).
Pooled SD: Sp = square root of [(44 times 146.41 plus 42 times 139.24) / 86] = square root of [(6442.04 plus 5848.08) / 86] = square root of [143.03] = 11.96.
Cohen's d: d = (78.3 minus 71.6) / 11.96 = 6.7 / 11.96 = 0.56.
Interpretation: The new teaching method produced a medium effect (d = 0.56) on exam performance. Students in the intervention group scored about half a standard deviation higher than those receiving traditional instruction.
Example 2: Hedges' g for a Small-Sample Study
Study: Same comparison but with smaller groups (n = 12 per group). Intervention mean = 82.1, SD = 14.3. Control mean = 73.5, SD = 13.8.
Cohen's d: d = (82.1 minus 73.5) / 14.05 = 8.6 / 14.05 = 0.612.
Correction factor J: J = 1 minus [3 / (4 times 22 minus 9)] = 1 minus [3 / 79] = 1 minus 0.038 = 0.962.
Hedges' g: g = 0.612 times 0.962 = 0.589.
Interpretation: After correcting for small-sample bias, the effect size is g = 0.589 (medium). The correction reduced the estimate by about 4%, which is typical for samples of this size. For a meta-analysis that pools this study with larger studies, using Hedges' g prevents the small study from inflating the pooled estimate.
Example 3: Odds Ratio for a Case-Control Study
Study: A case-control study of smoking and lung cancer. Among 200 lung cancer cases, 160 were smokers and 40 were non-smokers. Among 200 matched controls, 80 were smokers and 120 were non-smokers.
2x2 table: a = 160, b = 40, c = 80, d = 120.
Odds ratio: OR = (160 times 120) / (40 times 80) = 19,200 / 3,200 = 6.0.
Interpretation: The odds of lung cancer were 6 times higher among smokers compared to non-smokers (OR = 6.0). This is a very large effect. Note that because this is a case-control design, relative risk cannot be calculated directly.
Example 4: Relative Risk for a Cohort Study
Study: A cohort study following 1,000 vaccinated and 1,000 unvaccinated individuals for influenza infection over one flu season. Among vaccinated individuals, 50 developed influenza. Among unvaccinated individuals, 150 developed influenza.
Event rates: Vaccinated = 50/1000 = 0.05. Unvaccinated = 150/1000 = 0.15.
Relative risk: RR = 0.05 / 0.15 = 0.33.
Interpretation: Vaccinated individuals were 67% less likely to develop influenza compared to unvaccinated individuals (RR = 0.33, or equivalently, the risk was reduced by 1 minus 0.33 = 0.67). The absolute risk reduction was 10 percentage points (15% minus 5%), and the number needed to treat (NNT) was 10 (1 / 0.10), meaning 10 people need to be vaccinated to prevent one case of influenza.
Effect Size Conversion Between Measures
When conducting a meta-analysis, you may need to pool studies that report different effect size measures. Standard conversion formulas allow you to transform between the d-family and the OR family. [3]
Cohen's d to odds ratio: ln(OR) = d times (pi / square root of 3), which simplifies to ln(OR) = d times 1.814.
Odds ratio to Cohen's d: d = ln(OR) times (square root of 3 / pi), which simplifies to d = ln(OR) times 0.551.
Cohen's d to Pearson's r: r = d / square root of (d squared plus 4).
Pearson's r to Cohen's d: d = 2r / square root of (1 minus r squared).
These conversions assume certain distributional properties and should be used with caution. The d-to-OR conversion assumes logistic distributions, and the d-to-r conversion assumes equal group sizes. Report the original effect size alongside any converted value and note the conversion method used.
Effect Size Reporting Template
Use this template when reporting effect sizes in your manuscript or systematic review.
Study/Comparison: [Brief description of the comparison being quantified]
Effect size measure: [Cohen's d / Hedges' g / OR / RR / other]
Justification for measure: [Why this measure was chosen based on data type and study design]
Point estimate: [Calculated value]
95% confidence interval: [Lower bound, Upper bound]
Interpretation: [Plain language description of the magnitude and direction of the effect]
Context: [How this effect size compares to the field-specific minimum important difference or to other studies on the same topic]
Software used: [R/Stata/RevMan/Excel, with package name and version if applicable]
Filled Example:
Study/Comparison: Mindfulness-based stress reduction versus waitlist control on anxiety symptoms (GAD-7) at 12 weeks.
Effect size measure: Hedges' g.
Justification for measure: Continuous outcome variable measured with the same scale across groups. Hedges' g chosen over Cohen's d because this effect size will be pooled in a meta-analysis with studies of varying sample sizes.
Point estimate: g = 0.74.
95% confidence interval: [0.38, 1.10].
Interpretation: The mindfulness intervention produced a medium-to-large reduction in anxiety symptoms compared to the waitlist control. Participants in the intervention group scored approximately three-quarters of a standard deviation lower on the GAD-7.
Context: The minimum clinically important difference for the GAD-7 is approximately 4 points, corresponding to a d of about 0.5. This effect size exceeds that threshold, suggesting the intervention produces clinically meaningful improvement. The estimate is consistent with prior meta-analyses of mindfulness interventions for anxiety (pooled g = 0.63, Khoury et al. 2013).
Software used: R version 4.3.1, metafor package version 4.4-0.
Common Mistakes When Calculating and Reporting Effect Sizes
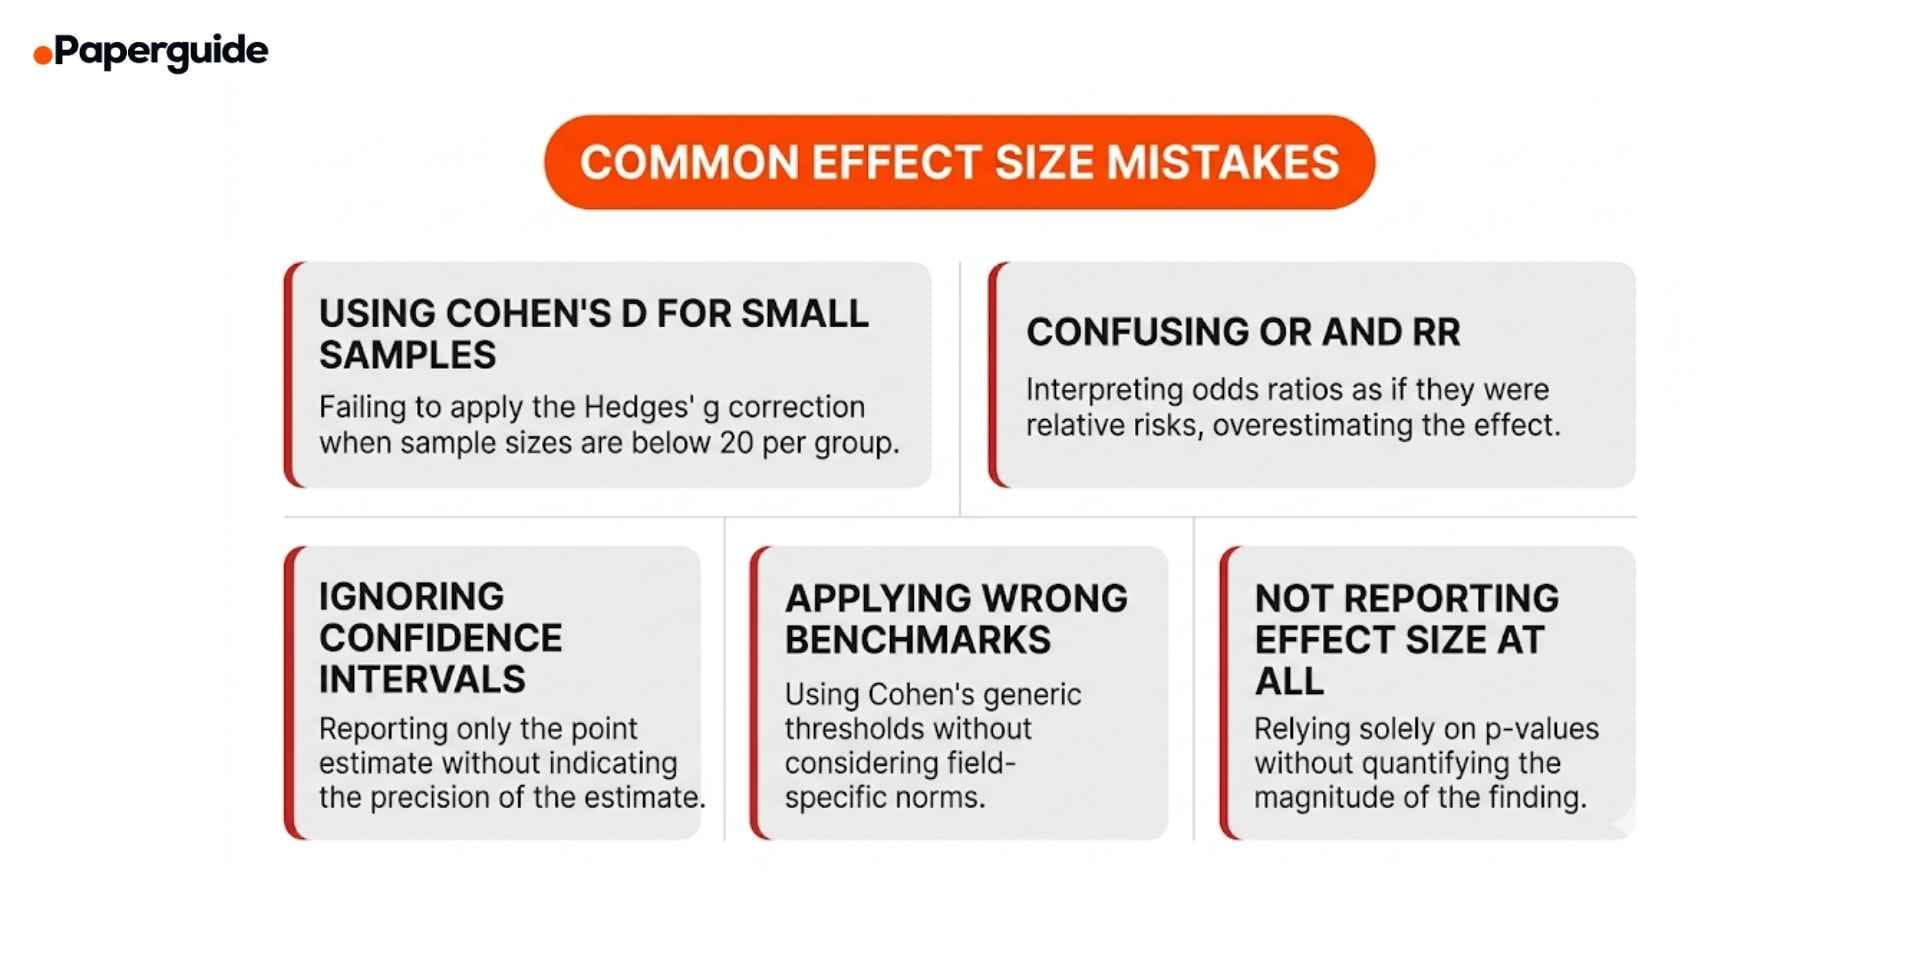
Mistake 1: Using Cohen's d Instead of Hedges' g for Small Samples
Cohen's d has a slight upward bias that increases as sample size decreases. For studies with fewer than 20 participants per group, this bias can inflate the effect size by 5% or more. When these biased estimates are pooled in a meta-analysis, the overall effect is systematically overestimated. [2]
Fix: Always apply the Hedges' g correction when sample sizes are small or when calculating effect sizes for meta-analysis. The correction is simple (multiply d by the J factor) and is built into all major meta-analysis software packages.
Mistake 2: Interpreting Odds Ratios as Relative Risk
When the outcome is common (prevalence above 10%), the odds ratio substantially overestimates the relative risk. An OR of 3.0 does not mean the risk is three times higher. It means the odds are three times higher, which is a different quantity. This mistake is particularly common in media reporting and clinical communications.
Fix: When the outcome prevalence is known and exceeds 10%, convert the odds ratio to a relative risk using the formula: RR = OR / (1 minus P0 plus P0 times OR), where P0 is the outcome prevalence in the unexposed group. Alternatively, use relative risk directly if the study design permits it.
Mistake 3: Reporting Effect Size Without a Confidence Interval
A point estimate without a confidence interval provides no information about the precision of the estimate. An effect size of d = 0.50 with a 95% CI of [0.42, 0.58] from a large meta-analysis tells a very different story from d = 0.50 with a 95% CI of [-0.30, 1.30] from a small pilot study.
Fix: Always calculate and report the 95% confidence interval alongside the point estimate. Use dedicated software (R metafor package, Stata metan, RevMan) that automatically computes CIs for each effect size.
Mistake 4: Applying Cohen's Benchmarks Without Context
Cohen himself described his benchmarks of 0.2, 0.5, and 0.8 as "crude" and recommended interpreting effect sizes in the context of the specific research domain. In some fields, a d of 0.2 represents a meaningful intervention effect, while in others a d of 0.8 would be unremarkable. [1][5]
Fix: Compare your effect size to published benchmarks for your specific field and outcome measure. Lakens (2013) and others have compiled field-specific effect size distributions that provide much more useful context than Cohen's generic thresholds.
Mistake 5: Not Reporting Effect Size at All
Despite APA guidelines requiring effect size reporting since 2001, many published studies still rely exclusively on p-values. This makes it impossible for readers to judge practical significance, for future meta-analysts to include the study in their synthesis, or for power analyses to use the study as a reference. Understanding the various formats of research papers and their reporting requirements helps researchers ensure they include all necessary statistical reporting elements. [4]
Fix: Report at least one effect size measure for every primary analysis, along with its 95% confidence interval. If the standard summary statistics (means, SDs, counts) are reported, readers can calculate effect sizes themselves, but providing the calculated value removes ambiguity and demonstrates best practice.
Effect Size Reporting Checklist
- [ ] Correct measure selected. Cohen's d or Hedges' g for continuous outcomes, OR for case-control or common outcomes, RR for cohort and RCT designs.
- [ ] Hedges' g used for meta-analysis. Small-sample correction applied when pooling effect sizes or when individual study samples are small.
- [ ] Point estimate reported. The calculated effect size value is clearly stated in the results section.
- [ ] 95% confidence interval included. The CI accompanies every point estimate to communicate precision.
- [ ] Interpretation provided. A plain-language description of the magnitude and direction of the effect is included.
- [ ] Context given. The effect size is compared to field-specific benchmarks, minimum important differences, or prior meta-analyses rather than relying solely on Cohen's generic thresholds.
- [ ] Formula or software documented. The calculation method, conversion formula (if applicable), and software package are reported for reproducibility.
- [ ] Multiple outcomes handled. Separate effect sizes are reported for each primary and secondary outcome rather than combining different measures.
- [ ] Conversions noted. If effect sizes were converted between families (e.g., d to OR), the conversion formula is documented.
- [ ] Raw data accessible. Means, SDs, sample sizes, or 2x2 tables are reported so readers can verify calculations or compute alternative measures.
When to Use Each Effect Size Measure
The decision framework below summarizes when each measure is most appropriate. Start with the type of outcome variable, then consider the study design and the intended analysis.
Use Cohen's d when you are reporting the results of a single study with continuous outcomes and both groups have at least 20 participants. Cohen's d is widely recognized, easy to interpret, and sufficient for most primary research reporting purposes.
Use Hedges' g when conducting a meta-analysis (regardless of individual study sample sizes), when any study in your review has fewer than 20 participants per group, or when you want the most unbiased estimate of the standardized mean difference. Hedges' g is the default for meta-analytic pooling in all major software packages. [2]
Use odds ratio when reporting results from case-control studies, logistic regression, or any analysis of binary outcomes where the outcome prevalence exceeds 10%. Odds ratios are also used in meta-analysis of binary outcomes when the included studies use different designs (cohort and case-control) because the OR can be computed from any 2x2 table regardless of design. [3]
Use relative risk when reporting results from cohort studies or RCTs with binary outcomes, especially when communicating results to clinical or policy audiences. Relative risk is more intuitive than the odds ratio because it directly estimates probability. However, it cannot be used for case-control designs and can be misleading when the baseline risk varies substantially across study populations.
Researchers who need to understand the relationship between systematic reviews and meta-analysis will find that effect size selection is one of the first methodological decisions that shapes the entire meta-analytic process.
Validate This With Papers (2 Minutes)
Before submitting your manuscript or finalizing your meta-analysis, verify that your effect size calculations and reporting meet the standards expected by journals and peer reviewers.
Step 1: Check your calculations against an independent source. Recalculate at least three effect sizes from your dataset using a different tool (R, Stata, or an online calculator) to verify that your primary calculations are correct. For meta-analyses, verify that the pooled effect size matches when you use a different software package.
Step 2: Use Paperguide's Abstract Generator to draft a summary of your findings that includes effect sizes, confidence intervals, and interpretation. Reviewing the AI-generated abstract alongside your own helps you identify any inconsistencies or gaps in how you present your effect size results.
Step 3: Compare your effect size reporting against published examples in your target journal. Paperguide's AI Writer can help you structure the results section to match the formatting conventions and level of detail expected by your specific journal, ensuring that all required statistical reporting elements are included.
This takes about two minutes and helps ensure your effect size reporting is accurate, complete, and aligned with current guidelines.
Conclusion
Effect size is the measure that transforms a statistical finding from a binary yes-or-no statement about significance into a meaningful quantification of how large and important the effect actually is. Cohen's d and Hedges' g provide standardized mean differences for continuous outcomes, with Hedges' g correcting for small-sample bias and serving as the standard for meta-analysis. Odds ratios and relative risk quantify associations with binary outcomes, each suited to specific study designs, with relative risk preferred for cohort studies and RCTs and odds ratios required for case-control designs.
Choosing the right measure, calculating it correctly, interpreting it in context rather than relying on generic benchmarks, and reporting it with a confidence interval are the four practices that distinguish strong quantitative research from research that leaves readers guessing about practical significance. Every researcher conducting primary studies should report effect sizes as a matter of course, and every systematic reviewer should extract, pool, and present effect sizes as the primary output of their synthesis. The formulas, examples, and decision framework in this guide provide the tools needed to do both with confidence.
Frequently Asked Questions
Can I calculate an effect size from a p-value alone?
Not precisely. A p-value by itself does not contain enough information to determine the effect size because it is influenced by both the effect magnitude and the sample size. However, if you know the p-value, the test statistic type (t, F, chi-square), and the sample sizes, you can back-calculate an approximate effect size using conversion formulas. For example, Cohen's d can be estimated from a t-value as d = 2t / square root of df.
Why does Hedges' g matter if the difference from Cohen's d is small?
The difference between Hedges' g and Cohen's d increases as sample size decreases. For n = 10 per group, the correction reduces the effect size by about 8%. When pooling many small studies in a meta-analysis, these individual biases accumulate and can meaningfully inflate the pooled estimate. Using Hedges' g consistently prevents this systematic overestimation.
When should I use Glass's delta instead of Cohen's d?
Use Glass's delta when the two groups have substantially different variances and you have a clear rationale for standardizing by one specific group's standard deviation (typically the control group). This is common in pre-test/post-test designs where the intervention may increase variability, or in treatment studies where you want to express the effect in terms of the control group's natural variation rather than a pooled estimate.
How do I interpret an odds ratio of 1.0?
An odds ratio of 1.0 means the odds of the outcome are identical in the two comparison groups, indicating no association between the exposure and the outcome. An OR above 1.0 indicates increased odds in the exposed group, and an OR below 1.0 indicates decreased odds. The further the OR is from 1.0 in either direction, the stronger the association.
Can I compare effect sizes across different measures?
Yes, using standard conversion formulas. Cohen's d can be converted to an odds ratio, and both can be converted to Pearson's r. However, these conversions involve distributional assumptions that may not hold in all situations. When converting, always report the original effect size alongside the converted value and document which conversion formula was used.
What is the minimum clinically important difference and how does it relate to effect size?
The minimum clinically important difference (MCID) is the smallest change in an outcome measure that patients or clinicians would consider meaningful. It is expressed in the original units of the outcome measure (e.g., 4 points on the GAD-7) rather than in standardized units. You can relate the MCID to effect size by dividing the MCID by the standard deviation of the outcome: d = MCID / SD. This provides a field-specific benchmark that is far more useful than Cohen's generic thresholds.
Should I report effect sizes for non-significant results?
Yes. Effect size reporting is important regardless of statistical significance. A non-significant result with a medium effect size (d = 0.50) and wide confidence interval suggests the study was underpowered, not that the effect does not exist. Reporting effect sizes for non-significant results contributes to more honest science and provides essential data for future power analyses and meta-analyses.
References
- Cohen, J. "Statistical Power Analysis for the Behavioral Sciences." 2nd edition, Lawrence Erlbaum Associates, 1988.
- Hedges, L.V. "Distribution Theory for Glass's Estimator of Effect Size and Related Estimators." Journal of Educational Statistics, 6(2), 1981.
- Borenstein, M., Hedges, L.V., Higgins, J.P.T. & Rothstein, H.R. "Introduction to Meta-Analysis." John Wiley & Sons, 2009.
- Sullivan, G.M. & Feinn, R. "Using Effect Size, or Why the P Value Is Not Enough." Journal of Graduate Medical Education, 4(3), 2012.
- Lakens, D. "Calculating and reporting effect sizes to facilitate cumulative science: a practical primer for t-tests and ANOVAs." Frontiers in Psychology,4, 2013.