
Publication Bias: Funnel Plots, Egger's Test + Prevention


Publication bias occurs when the results of a study influence whether it is published, creating a systematic distortion in the available evidence. Studies with statistically significant, positive, or novel findings are more likely to be published than studies with null, negative, or inconclusive results. When a systematic review or meta-analysis draws only from published literature, the pooled effect estimate may overestimate the true effect because the studies that found smaller or no effects are missing from the evidence base. This phenomenon, sometimes called the "file drawer problem," represents one of the most serious threats to the validity of evidence synthesis. [1]
Detecting and addressing publication bias is a required step in any well-conducted systematic review. The Cochrane Handbook, PRISMA guidelines, and GRADE framework all require reviewers to assess and report on publication bias. The primary detection methods include visual inspection of funnel plots, statistical tests such as Egger's regression and Begg's rank correlation, and sensitivity analyses using the trim and fill method, p-curve analysis, and selection models. This guide explains what publication bias is, how to detect it using each method, how to interpret the results, and how to minimize its impact on your review's conclusions. [4]
Key Takeaways
- Publication bias occurs when studies with significant or favorable results are more likely to be published, leading meta-analyses to overestimate true effects
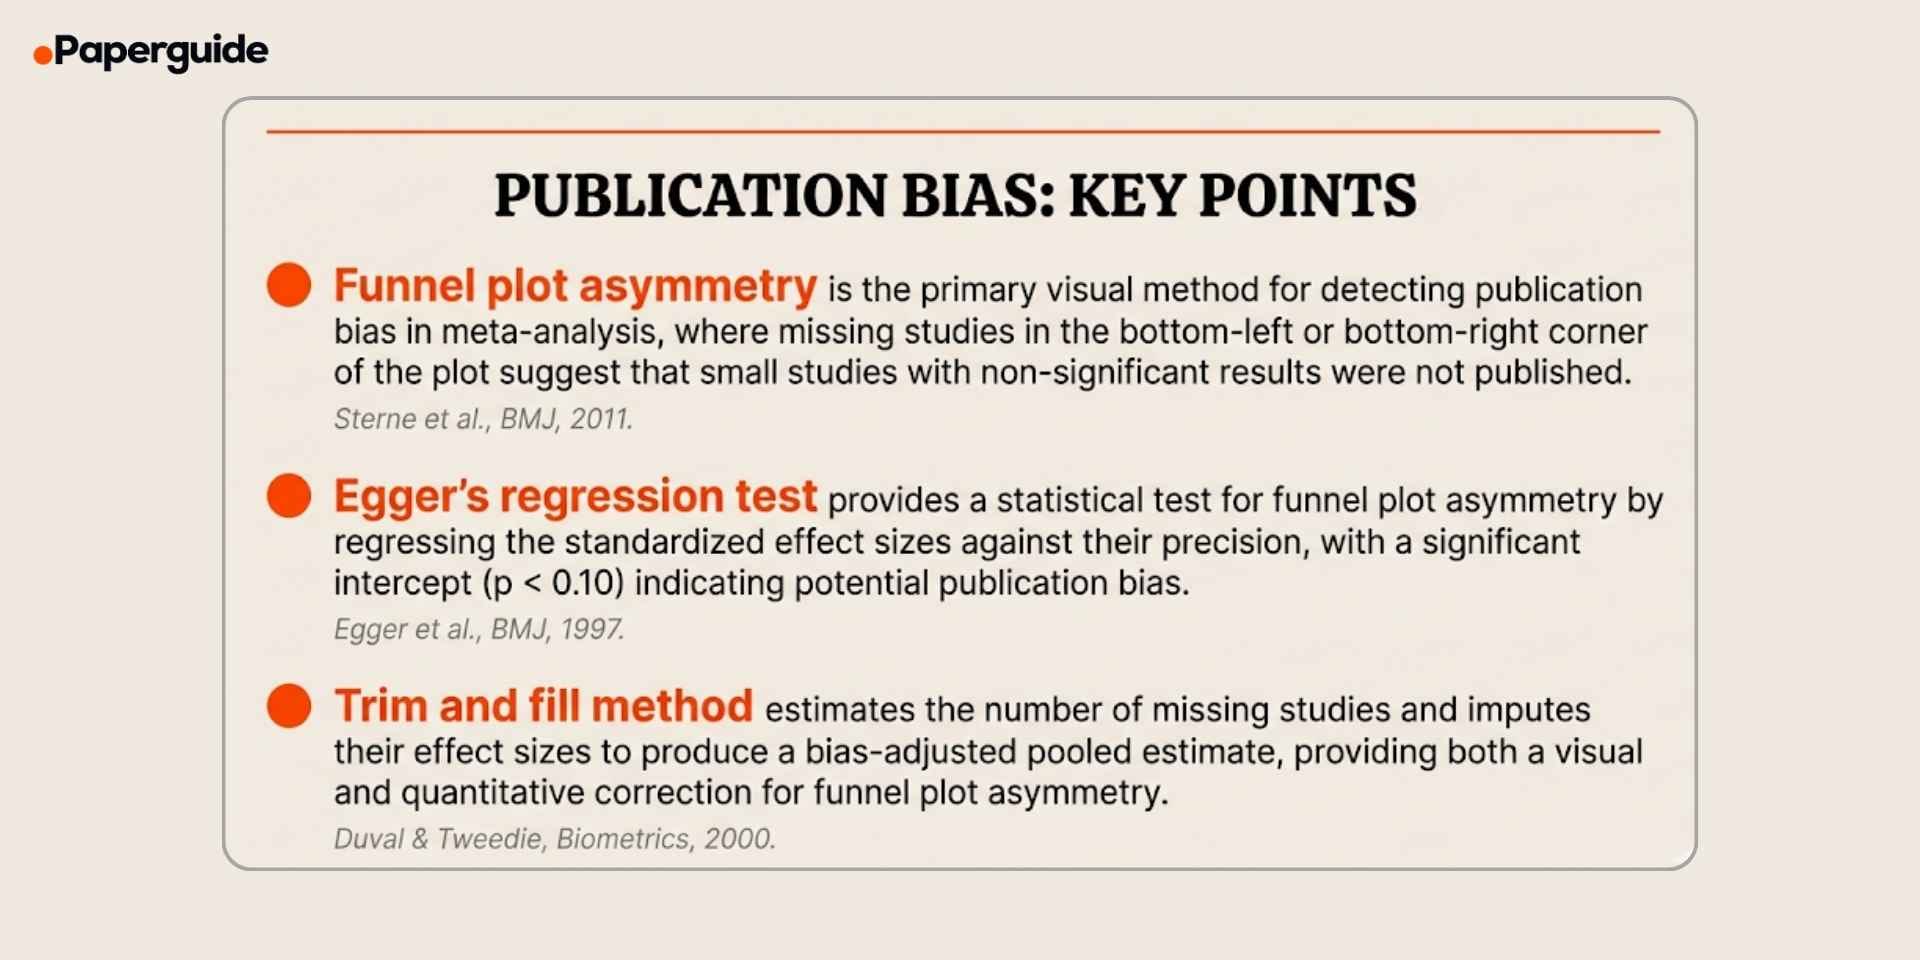
- Funnel plots provide a visual assessment by plotting effect sizes against their precision; asymmetry in the plot suggests missing studies
- Egger's regression test statistically tests for funnel plot asymmetry and is recommended when the meta-analysis includes at least 10 studies
- The trim and fill method estimates the number of missing studies and adjusts the pooled estimate, but it assumes the asymmetry is entirely due to publication bias
- Prevention strategies include pre-registering studies, searching grey literature and trial registries, and using reporting guidelines such as PRISMA that require publication bias assessment
What Is Publication Bias?
Publication bias is the tendency for the publication of research to depend on the nature and direction of results rather than on the quality of the study design. [1] Studies that find statistically significant effects, larger effect sizes, or results that confirm prevailing hypotheses are more likely to be submitted by researchers, accepted by journals, and ultimately available for inclusion in systematic reviews and meta-analyses.
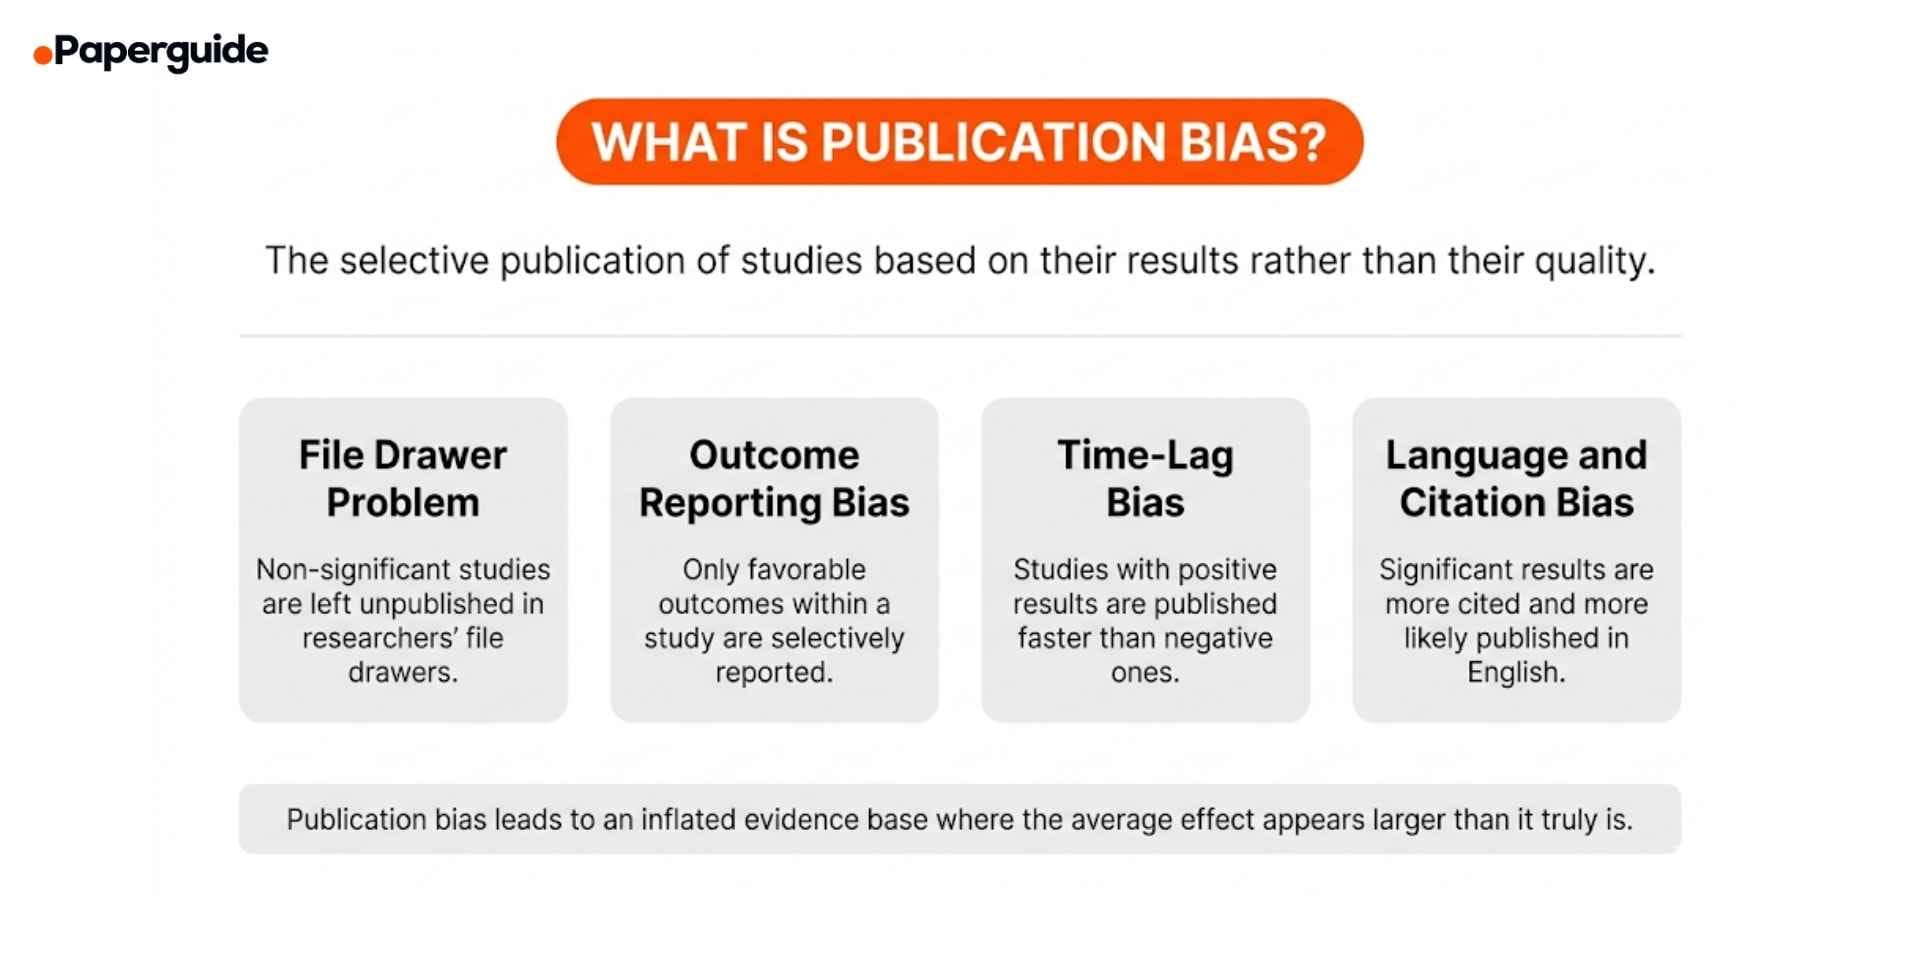
Publication bias operates at multiple levels. Researchers may choose not to write up null findings. Journals may reject manuscripts with non-significant results during peer review. Even when null studies are published, they tend to appear in lower-impact journals, making them harder to find during literature searches. The combined effect is that the published literature systematically overrepresents studies with positive findings. [1][4]
The consequences are substantial. A meta-analysis that pools only published studies may produce a pooled effect estimate that is 30% or more larger than the true effect. Treatment guidelines based on biased meta-analyses may recommend interventions that are less effective than the evidence suggests. Policy decisions based on inflated effect sizes may allocate resources to programs that deliver smaller benefits than expected. For these reasons, assessing and reporting on publication bias is not optional in evidence synthesis. It is a required methodological step that directly affects the credibility of the review's conclusions. Researchers who understand how different research methodologies handle bias are better prepared to design reviews that anticipate and address publication bias from the protocol stage.
Funnel Plots vs Egger's Test vs Trim and Fill (Comparison)
Each method for detecting publication bias has different strengths, assumptions, and appropriate use cases. Combining multiple methods provides a more robust assessment than relying on any single approach.
| Feature | Funnel Plot | Egger's Test | Trim and Fill |
|---|---|---|---|
| Type | Visual | Statistical | Statistical + Visual |
| What it detects | Asymmetry in the distribution of effect sizes by precision | Statistical evidence of funnel plot asymmetry | Estimates number and location of missing studies |
| Minimum studies | 10 (visual inspection unreliable below this) | 10 | 10 |
| Output | Scatter plot with pseudo 95% CI | Regression coefficient and p-value | Adjusted pooled estimate and imputed studies |
| Null hypothesis | Studies are symmetrically distributed around the pooled effect | Intercept of regression line equals zero | No missing studies |
| Significance threshold | Visual judgment (subjective) | p < 0.10 (conventional) | Not a formal hypothesis test |
| Key limitation | Subjective, affected by heterogeneity | Low power with fewer than 10 studies | Assumes asymmetry is caused by publication bias |
| Primary reference | Sterne et al. (2011) | Egger et al. (1997) | Duval & Tweedie (2000) |
Funnel plots are the starting point for publication bias assessment. Egger's test adds statistical rigor to what is otherwise a subjective visual judgment. Trim and fill goes further by estimating what the pooled effect would be if the missing studies were present. However, asymmetry in any of these methods can result from causes other than publication bias, including genuine heterogeneity, methodological differences between small and large studies, or chance variation.
How to Detect and Assess Publication Bias (5 Steps)
The five steps below provide a systematic approach to publication bias assessment in any meta-analysis. The Cochrane Handbook and PRISMA guidelines recommend using multiple methods rather than relying on a single test. [5]
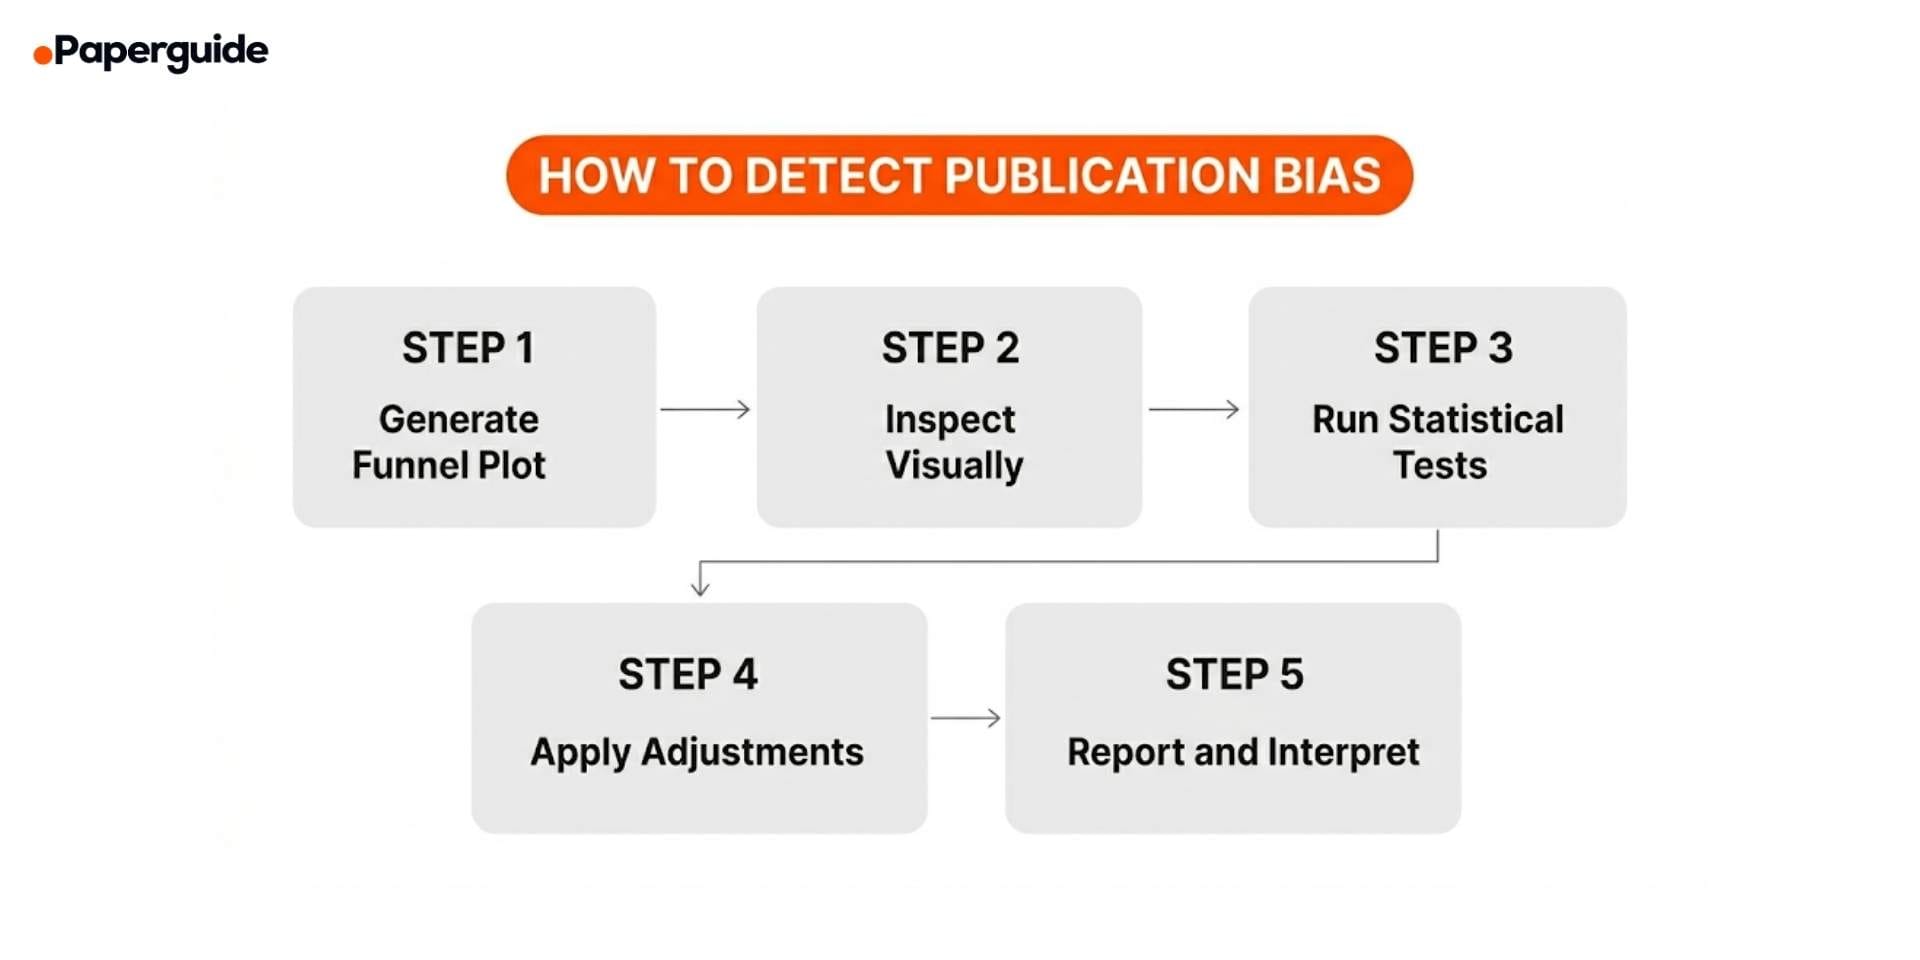
Step 1: Generate a Funnel Plot
A funnel plot is a scatter plot that displays each study's effect size (on the x-axis) against a measure of its precision (on the y-axis, typically the standard error, with the most precise studies at the top). In the absence of publication bias and heterogeneity, studies should scatter symmetrically around the pooled effect estimate, forming an inverted funnel shape. Larger, more precise studies cluster near the top around the pooled estimate, while smaller, less precise studies spread more widely at the bottom.
Generate the funnel plot using your meta-analysis software. In R, the metafor package produces funnel plots with the funnel() function. In Stata, use the metafunnel command. In RevMan, the funnel plot is available in the analysis output options. Include the pseudo 95% confidence interval (the diagonal lines) to provide a reference for expected scatter.
Step 2: Visually Inspect the Funnel Plot for Asymmetry
Examine the funnel plot for signs of asymmetry. In a symmetric plot, the studies at the bottom (smaller, less precise) should scatter equally on both sides of the pooled estimate. If the bottom-left area (small studies with small or null effects) is noticeably empty while the bottom-right (small studies with large effects) is populated, this suggests that small studies with non-significant results were not published. [4]
However, visual inspection is subjective and should never be the sole basis for concluding that publication bias exists. Asymmetry can also result from genuine differences between small and large studies (for example, if small studies used more intensive interventions), statistical artifacts from the effect size metric used, or chance variation when fewer than 10 studies are included. Always follow visual inspection with formal statistical tests.
Step 3: Run Statistical Tests for Asymmetry
Egger's regression test is the most widely used statistical test for funnel plot asymmetry. It works by regressing the standardized effect sizes (effect size divided by its standard error) against their precision (1 / standard error). If no publication bias is present, the regression line should pass through the origin (intercept = 0). A significant intercept (p < 0.10, using the conventional threshold) suggests asymmetry. [2]
In R: regtest(meta_model, model = "lm") from the metafor package. In Stata: metabias, egger. In RevMan: not directly available (calculate externally).
Begg's rank correlation test is an alternative that tests whether there is a correlation between the effect sizes and their variances using Kendall's tau. It has lower statistical power than Egger's test and is generally less recommended, but reporting both provides complementary evidence. [2]
Important limitation: Both tests have low power when the meta-analysis includes fewer than 10 studies. With 10 to 20 studies, the tests can detect only severe asymmetry. With fewer than 10 studies, neither test is recommended, and the funnel plot itself is considered unreliable. In these cases, describe the potential for publication bias qualitatively rather than relying on statistical tests.
Step 4: Apply Sensitivity Analyses and Adjustment Methods
If the funnel plot and statistical tests suggest asymmetry, apply one or more adjustment methods to estimate how publication bias may have affected the pooled result. [3][4]
Trim and fill method: This non-parametric method estimates the number of "missing" studies on the less populated side of the funnel plot, imputes their effect sizes to make the plot symmetric, and recalculates the pooled estimate including the imputed studies. The difference between the original and adjusted pooled estimates indicates the potential magnitude of publication bias. In R: trimfill(meta_model). In Stata: metatrim.
P-curve analysis: This method examines the distribution of statistically significant p-values across the included studies. If the true effect exists, significant p-values should be right-skewed (more p-values near 0.01 than near 0.05). A flat or left-skewed distribution suggests that the significant results may reflect p-hacking or selective reporting rather than a genuine effect.
Selection models: These parametric models explicitly model the relationship between a study's probability of publication and its p-value or effect size. The Vevea and Hedges (1995) selection model and the Copas selection model allow the analyst to estimate what the pooled effect would be under different assumptions about the strength of the publication selection mechanism. Researchers who want to frame their review questions precisely from the outset can benefit from well-structured research question examples that define clear PICO criteria, reducing the scope for ambiguity when conducting sensitivity analyses.
Step 5: Report and Interpret Your Findings
Report the results of your publication bias assessment in the results section of your review. Include the funnel plot as a figure, state the results of statistical tests with their test statistics and p-values, and report the adjusted pooled estimate from the trim and fill or selection model analyses. [5]
Be transparent about what the assessment can and cannot tell you. Funnel plot asymmetry can indicate publication bias, but it can also reflect other sources of small-study effects. A non-significant Egger's test does not prove the absence of publication bias; it may simply reflect low statistical power. The trim and fill adjustment assumes that all asymmetry is due to publication bias, which may overcorrect if other factors contribute to the asymmetry.
Example reporting text: "The funnel plot showed evidence of asymmetry, with an apparent absence of small studies with effect sizes near or below the null (Supplementary Figure 3). Egger's regression test confirmed this asymmetry (intercept = 2.14, p = 0.03). The trim and fill method estimated four missing studies and produced an adjusted pooled estimate of d = 0.42 (95% CI [0.21, 0.63]), compared to the original pooled estimate of d = 0.58 (95% CI [0.38, 0.78]). This suggests that publication bias may have inflated the pooled effect by approximately 28%. However, the adjusted estimate remained statistically significant and clinically meaningful."
Publication Bias Assessment Examples (Worked Through)
Below are three examples demonstrating how to apply the detection methods in practice.
Example 1: Funnel Plot Assessment of a Meta-Analysis of 18 RCTs
Context: A meta-analysis of 18 RCTs evaluating cognitive behavioral therapy (CBT) for depression, with a pooled effect of g = 0.62 (95% CI [0.44, 0.80]).
Funnel plot observation: The plot showed 5 large studies (n > 100) clustered tightly around g = 0.50 at the top of the funnel. The 13 smaller studies were distributed asymmetrically, with 9 on the right side (larger effects, g = 0.60 to 1.20) and only 4 on the left side (smaller effects, g = 0.15 to 0.45). The bottom-left area of the funnel was notably sparse.
Interpretation: The asymmetry suggests that small studies with smaller effects may be missing from the literature. This is consistent with publication bias, though it could also reflect genuinely different intervention delivery in smaller versus larger trials (smaller studies may have used more intensive, personalized CBT protocols).
Example 2: Egger's Test with Significant Result
Context: Same 18-study meta-analysis. Egger's regression test yielded an intercept of 1.87 (95% CI [0.42, 3.32], p = 0.014). Begg's rank correlation test yielded tau = 0.31 (p = 0.07).
Interpretation: Both tests provide evidence of funnel plot asymmetry. Egger's test is significant at p = 0.014 (well below the conventional 0.10 threshold). Begg's test approaches significance. The converging evidence from visual inspection and two statistical tests strengthens the conclusion that asymmetry is present. However, the tests cannot distinguish publication bias from other causes of small-study effects.
Example 3: Trim and Fill Adjustment
Context: Applying the trim and fill method to the same meta-analysis.
Result: The method estimated 3 missing studies on the left side of the funnel plot with imputed effect sizes of g = 0.08, g = 0.22, and g = 0.31. Including these imputed studies, the adjusted pooled estimate was g = 0.51 (95% CI [0.33, 0.69]), compared to the original g = 0.62.
Interpretation: The adjusted estimate is 18% smaller than the original, suggesting moderate publication bias. The adjusted effect remains a medium effect and is still statistically significant, indicating that the overall conclusion (CBT is effective for depression) is robust to potential publication bias, though the magnitude of the effect may be somewhat smaller than the published evidence alone suggests.

Publication Bias Assessment Template
Use this template to document your publication bias assessment for each meta-analysis in your review.
Meta-analysis: [Outcome, comparison, number of studies included]
Funnel plot: [Describe symmetry/asymmetry, which area of the plot is sparse, number of outliers]
Egger's test: Intercept = [value], 95% CI = [lower, upper], p = [value]. Interpretation: [significant/non-significant asymmetry]
Begg's test: Kendall's tau = [value], p = [value]. Interpretation: [consistent/inconsistent with Egger's result]
Trim and fill: Estimated missing studies = [number]. Original pooled estimate = [value, CI]. Adjusted pooled estimate = [value, CI]. Percentage change = [value]%.
Overall assessment: [Low/moderate/high concern for publication bias]. Rationale: [summary of evidence from all methods].
Impact on conclusions: [Does the adjusted estimate change the direction or clinical significance of the finding?]
Filled Example:
Meta-analysis: CBT versus control for depression symptoms (BDI-II) at post-treatment, 18 RCTs.
Funnel plot: Asymmetric. Bottom-left region sparse (4 studies) compared to bottom-right (9 studies). Five large studies clustered near g = 0.50.
Egger's test: Intercept = 1.87, 95% CI = [0.42, 3.32], p = 0.014. Interpretation: Statistically significant asymmetry detected.
Begg's test: Kendall's tau = 0.31, p = 0.07. Interpretation: Approaches significance, consistent with Egger's result.
Trim and fill: Estimated missing studies = 3. Original pooled estimate = g = 0.62 (95% CI [0.44, 0.80]). Adjusted pooled estimate = g = 0.51 (95% CI [0.33, 0.69]). Percentage change = 18% reduction.
Overall assessment: Moderate concern for publication bias. Both statistical tests and visual inspection converge on asymmetry. The trim and fill adjustment reduces the effect size but does not eliminate statistical or clinical significance.
Impact on conclusions: The adjusted estimate (g = 0.51) still exceeds the minimum clinically important difference and remains statistically significant. The overall conclusion that CBT is effective for depression is robust to potential publication bias, but the true effect may be closer to a medium rather than medium-to-large effect.
Common Mistakes in Publication Bias Assessment
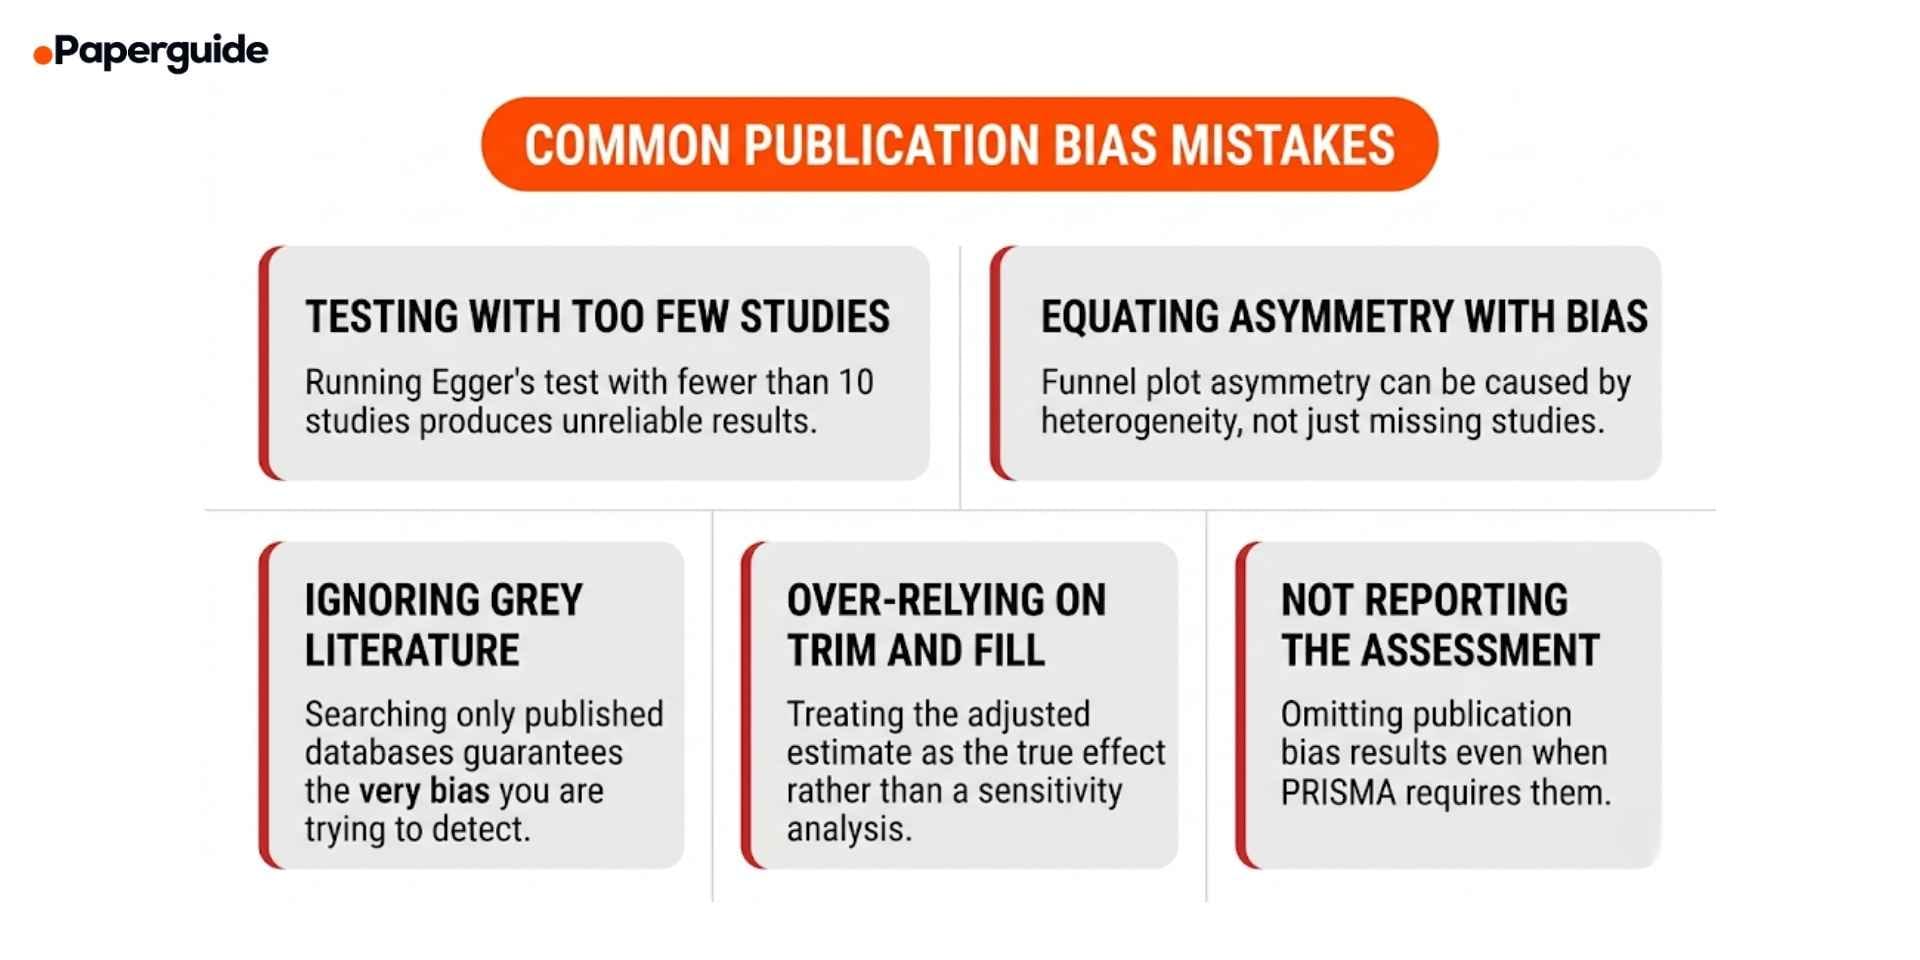
Mistake 1: Running Statistical Tests with Fewer Than 10 Studies
Egger's test and Begg's test both have extremely low statistical power when the meta-analysis includes fewer than 10 studies. A non-significant p-value in this situation provides essentially no evidence against publication bias. It simply means the test could not detect it given the small number of studies. [2][4]
Fix: When your meta-analysis includes fewer than 10 studies, do not report Egger's or Begg's test results as evidence for or against publication bias. Instead, acknowledge the limitation and describe the potential for publication bias qualitatively based on your search strategy (did you search trial registries and grey literature?) and the characteristics of the included studies.
Mistake 2: Equating Funnel Plot Asymmetry with Publication Bias
Funnel plot asymmetry has several potential causes beyond publication bias. True heterogeneity (systematic differences between small and large studies), poor methodological quality in smaller studies (leading to inflated effects), and the choice of effect size metric can all produce asymmetric funnel plots even when no publication bias exists. [4]
Fix: When asymmetry is detected, consider and discuss alternative explanations. If small studies differed systematically from large studies in design, population, or intervention intensity, the asymmetry may reflect genuine heterogeneity rather than missing studies. Use subgroup analyses or meta-regression to investigate whether study-level characteristics explain the asymmetry.
Mistake 3: Not Searching Grey Literature and Trial Registries
If your search strategy only includes published journal articles from major databases, you are building in the very bias you are trying to detect. Unpublished studies, conference abstracts, dissertations, and trial registry results are precisely the sources most likely to contain the null findings that publication bias suppresses. [5]
Fix: Search ClinicalTrials.gov, WHO ICTRP, OpenGrey, ProQuest Dissertations, and conference abstract databases. Compare the results of registered trials against published papers to identify studies that were completed but never published. Include these sources in your systematic search strategy and document them in your PRISMA flow diagram.
Mistake 4: Treating Trim and Fill Estimates as the True Effect
The trim and fill method provides a useful sensitivity analysis, but the adjusted estimate should not be presented as the "corrected" true effect. The method assumes that all funnel plot asymmetry is caused by publication bias, which may not be true. It also assumes a specific pattern of missingness that may not match reality. [3]
Fix: Present the trim and fill result as one of several sensitivity analyses rather than as a definitive correction. Report both the original and adjusted estimates, and discuss the plausible range of the true effect given the evidence for publication bias. Researchers who work with various research tools across their academic workflow understand that no single correction method replaces a comprehensive and transparent search strategy.
Mistake 5: Omitting the Publication Bias Assessment Entirely
Despite PRISMA and Cochrane requirements, many published systematic reviews either omit publication bias assessment or mention it only in passing without formal testing or transparent reporting. [5]
Fix: Include the funnel plot as a figure, report statistical test results with exact values, present sensitivity analysis results, and discuss the potential impact on your conclusions. Even when the assessment suggests low concern for publication bias, reporting the methods and results demonstrates methodological rigor.
Publication Bias Prevention and Reduction Checklist
- [ ] Trial registries searched. ClinicalTrials.gov, WHO ICTRP, and other relevant registries were searched and documented in the search strategy.
- [ ] Grey literature included. Dissertations, conference abstracts, preprints, and unpublished reports were actively sought.
- [ ] Registered studies compared to published studies. Completed trials identified in registries were compared against published papers to identify unpublished studies.
- [ ] Funnel plot generated. A funnel plot was created for each meta-analysis with 10 or more studies.
- [ ] Statistical tests performed. Egger's regression test (and optionally Begg's test) was conducted and results reported with exact test statistics and p-values.
- [ ] Trim and fill applied. The adjusted pooled estimate was calculated and compared to the original estimate.
- [ ] Alternative explanations considered. Heterogeneity, methodological differences, and metric artifacts were discussed as potential explanations for any detected asymmetry.
- [ ] Sensitivity analyses conducted. Results were compared with and without potentially biased studies, outliers, or grey literature sources.
- [ ] GRADE assessment updated. Publication bias findings were incorporated into the GRADE certainty of evidence rating for each outcome.
- [ ] Transparent reporting. All publication bias methods, results, and interpretations were reported in accordance with PRISMA 2020 requirements.
How to Prevent Publication Bias in Your Own Research
While detection methods address publication bias after the fact, prevention strategies tackle the problem at its source. Researchers can take several steps to reduce publication bias in their own work and in the broader scientific literature. [1][5]
Pre-register your study. Register your study protocol, hypotheses, primary outcomes, and analysis plan on a public registry (ClinicalTrials.gov for clinical trials, OSF for other study types, PROSPERO for systematic reviews) before data collection begins. Pre-registration creates a public record of the study, making it difficult for null results to simply disappear.
Submit to registered reports journals. Registered reports undergo peer review at the protocol stage, before results are known. Accepted protocols are guaranteed publication regardless of results, eliminating the incentive for both researchers and journals to suppress null findings.
Publish null results. If your study produces null or negative findings, submit it for publication. Journals such as PLOS ONE, BMC Research Notes, and the Journal of Articles in Support of the Null Hypothesis specifically welcome null results. Even posting a preprint on a public repository ensures the results are available for future meta-analysts.
Search comprehensively when conducting reviews. When you are the one conducting a systematic review, design your search strategy to minimize publication bias from the start. Include grey literature sources, contact study authors for unpublished data, and search trial registries to identify completed but unpublished studies. Researchers who explore AI tools for comparing and evaluating research platforms should note that comprehensive search strategies are the single most important defense against publication bias in evidence synthesis.
Validate This With Papers (2 Minutes)
Before finalizing your publication bias assessment, verify that your methods and reporting meet the standards expected by Cochrane and PRISMA guidelines.
Step 1: Check that your funnel plot includes the correct axes (effect size on x-axis, standard error on y-axis with the most precise studies at the top) and includes the pseudo 95% confidence interval lines. Verify that outliers are labeled with study identifiers.
Step 2: Use Paperguide's AI Conclusion Writer to draft the publication bias section of your discussion, ensuring that the text accurately reflects the statistical results, considers alternative explanations for asymmetry, and discusses the impact on your review's overall conclusions.
Step 3: Verify the consistency of your reporting by reviewing your statistical test results. Paperguide's Essay Summarizer can help you condense your publication bias findings into a clear summary paragraph that captures the key numbers and interpretation without unnecessary length.
This takes about two minutes and helps ensure your publication bias assessment is thorough, transparent, and aligned with current best practice.
Conclusion
Publication bias is the silent distortion that can undermine even the most carefully conducted systematic review. When studies with significant results are published at higher rates than studies with null findings, the available evidence base becomes systematically skewed, and meta-analytic pooling amplifies this skew rather than correcting it. Detecting this bias requires a combination of visual methods (funnel plots), statistical tests (Egger's regression, Begg's rank correlation), and sensitivity analyses (trim and fill, p-curve, selection models), with no single method sufficient on its own.
The most effective defense against publication bias is not detection but prevention. Pre-registering studies, searching grey literature and trial registries, including unpublished data, and publishing null results all reduce the asymmetry in the evidence base before a meta-analysis even begins. For researchers conducting systematic reviews, following PRISMA 2020 reporting guidelines ensures that publication bias assessment is documented transparently, allowing readers to evaluate for themselves how much confidence to place in the pooled estimates. The methods, examples, and checklist in this guide provide the practical tools needed to assess and report publication bias with the rigor that evidence-based practice demands.
Frequently Asked Questions
What is the file drawer problem?
The file drawer problem, first described by Rosenthal in 1979, refers to the observation that studies with non-significant or negative results tend to remain unpublished in researchers' "file drawers" rather than being submitted and published in journals. Rosenthal proposed calculating the "fail-safe N," the number of unpublished null studies that would be needed to make the pooled effect non-significant. While the fail-safe N is now considered a crude measure, the concept it describes remains central to understanding publication bias.
Can funnel plots detect publication bias in small meta-analyses?
No. Funnel plots are unreliable when the meta-analysis includes fewer than 10 studies because the visual pattern cannot be meaningfully distinguished from random variation. Both the Cochrane Handbook and Sterne and colleagues (2011) explicitly recommend against interpreting funnel plots in meta-analyses with fewer than 10 studies.
What does a significant Egger's test prove?
A significant Egger's test (p < 0.10) provides statistical evidence of funnel plot asymmetry, but it does not prove that publication bias is the cause. Asymmetry can also result from genuine heterogeneity, differences in study quality between small and large studies, or the choice of effect size metric. Egger's test should be interpreted alongside visual inspection and consideration of alternative explanations.
Is the trim and fill adjustment reliable?
The trim and fill method is useful as a sensitivity analysis but has known limitations. It assumes a specific pattern of missing studies that may not match reality, and it can both undercorrect (when the true pattern of suppression is different) and overcorrect (when asymmetry is caused by heterogeneity rather than publication bias). Report the adjusted estimate as a sensitivity analysis, not as the definitive true effect.
How does p-curve analysis differ from funnel plot methods?
P-curve analysis examines the distribution of statistically significant p-values rather than the relationship between effect sizes and precision. A right-skewed p-curve (more p-values near 0.01 than near 0.05) suggests evidential value. A flat or left-skewed p-curve suggests that the significant results may reflect p-hacking or selective reporting. P-curve complements funnel plot methods by addressing a different mechanism of bias (selective reporting of outcomes within studies) rather than selective publication of entire studies.
Should I still assess publication bias if I searched grey literature?
Yes. Searching grey literature reduces but does not eliminate publication bias. Many unpublished studies remain inaccessible even with comprehensive searching, and selective outcome reporting within published studies is a separate source of bias that grey literature searching does not address. Publication bias assessment should be conducted regardless of how thorough the search strategy was.
How do I report publication bias in a PRISMA-compliant review?
PRISMA 2020 requires reporting of methods used to assess publication bias (item 15), results of the assessment (item 21), and a discussion of the impact on the certainty of evidence (item 24). Include the funnel plot as a figure, report Egger's test results with exact statistics, present the trim and fill adjusted estimate, and discuss how these findings affect confidence in the pooled results. GRADE assessments should rate down for publication bias when it is detected.
References
- Rothstein, H.R., Sutton, A.J. & Borenstein, M. "Publication Bias in Meta-Analysis: Prevention, Assessment and Adjustments." John Wiley & Sons, 2005.
- Egger, M., Davey Smith, G., Schneider, M. & Minder, C. "Bias in meta-analysis detected by a simple, graphical test." BMJ, 315(7109), 1997.
- Duval, S. & Tweedie, R. "Trim and Fill: A Simple Funnel-Plot-Based Method of Testing and Adjusting for Publication Bias in Meta-Analysis." Biometrics, 56(2), 2000.
- Sterne, J.A.C. et al. "Recommendations for examining and interpreting funnel plot asymmetry in meta-analyses of randomised controlled trials." BMJ, 343, 2011.
- Page, M.J. et al. "The PRISMA 2020 statement: an updated guideline for reporting systematic reviews." BMJ, 372, 2021.