
How to Assess Risk of Bias: RoB 2, ROBINS-I + QUADAS-2


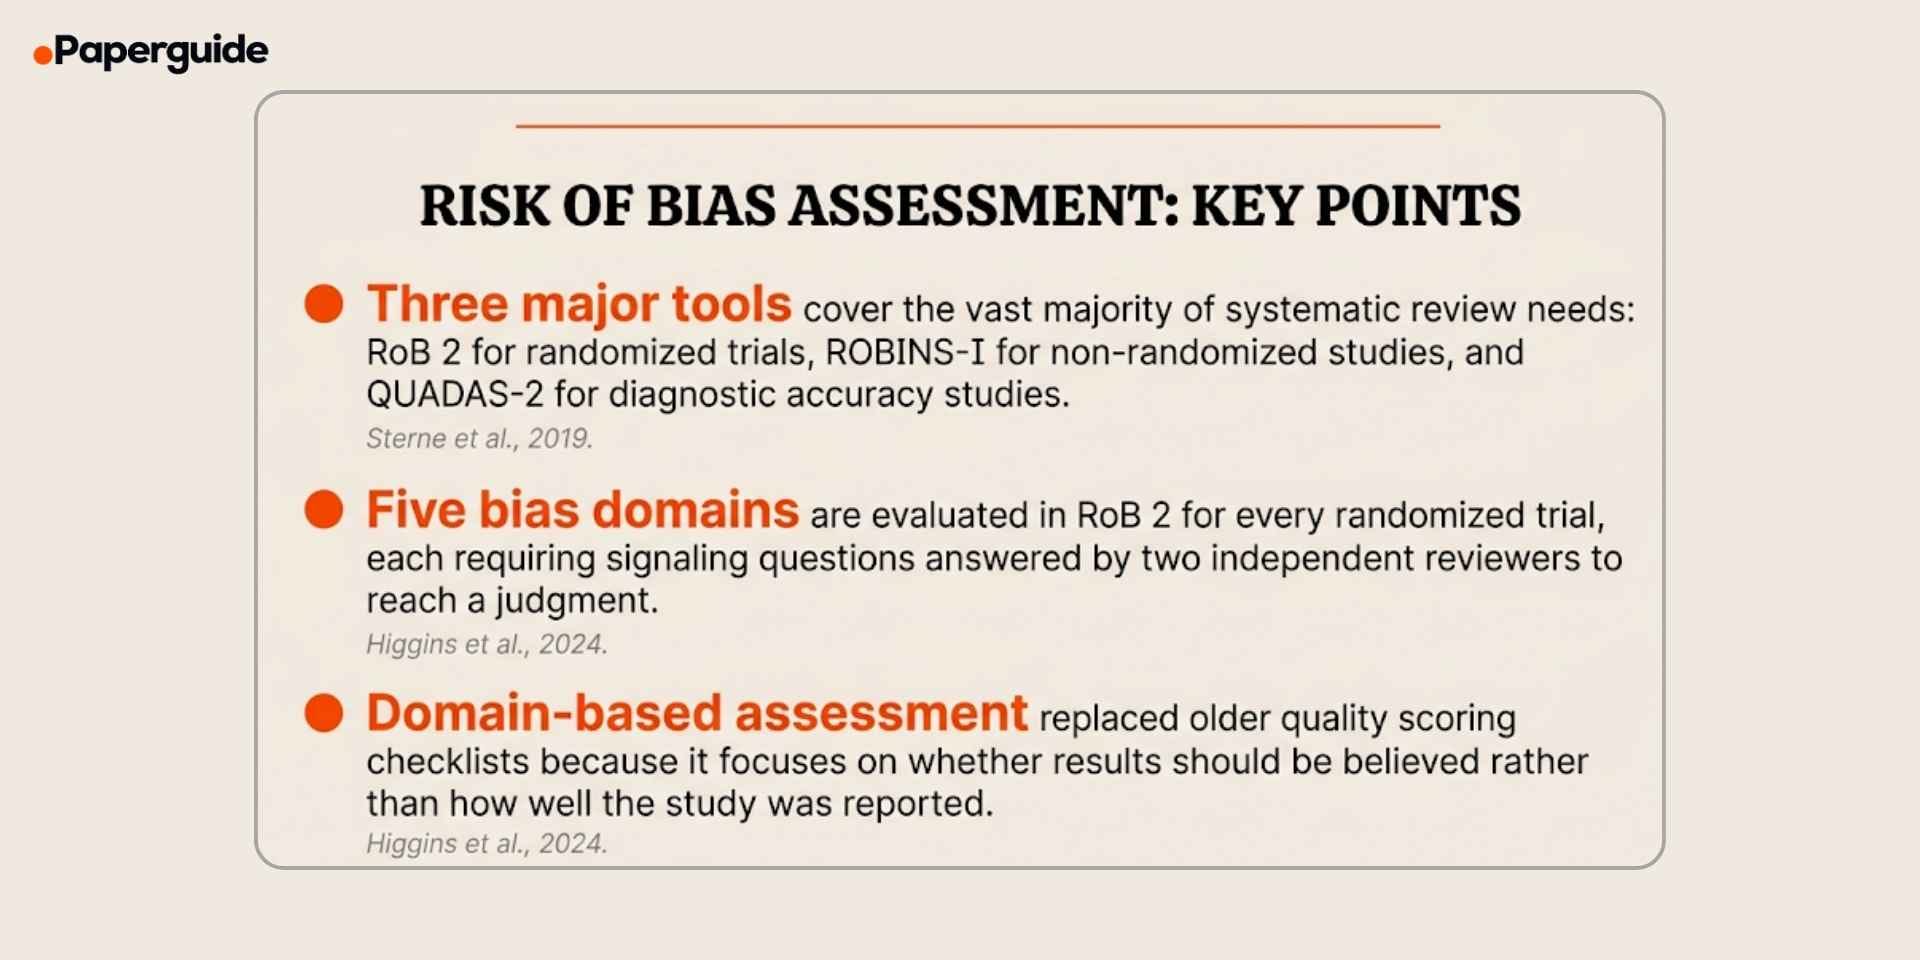
Risk of bias assessment is the process of evaluating whether the design, conduct, or analysis of a study may have distorted its results. Every systematic review includes a risk of bias assessment because flawed studies can produce misleading conclusions, and without a formal evaluation, reviewers have no structured way to distinguish trustworthy evidence from evidence that may be compromised by methodological weaknesses. The three most widely used tools are the Cochrane Risk of Bias 2 (RoB 2) for randomized trials, ROBINS-I for non-randomized studies of interventions, and QUADAS-2 for diagnostic accuracy studies. [1]
Understanding which tool to use, how each tool structures its assessment, and how to apply signaling questions to reach domain-level judgments is essential for any researcher conducting a systematic review or critically appraising published evidence. A poorly conducted risk of bias assessment can undermine an otherwise rigorous review, while a well-conducted one strengthens the credibility of the synthesis and helps readers understand how much confidence to place in the findings. This guide explains what risk of bias means, compares the three major tools, walks through the assessment process step by step with worked examples for each tool, and provides a template and quality checklist for your own assessments. [4]
Key Takeaways
- Risk of bias assessment evaluates whether study design, conduct, or analysis may have systematically distorted results, and it is a required step in every systematic review
- RoB 2 assesses five domains for randomized controlled trials: randomization process, deviations from intended interventions, missing outcome data, measurement of the outcome, and selection of reported results
- ROBINS-I evaluates seven domains for non-randomized studies, adding confounding and selection of participants into the study as additional sources of bias
- QUADAS-2 covers four domains for diagnostic accuracy studies (patient selection, index test, reference standard, flow and timing) and separately assesses applicability concerns
- Results are presented using traffic light plots and weighted bar charts generated with tools such as the robvis R package or Shiny web app
What Is Risk of Bias?
Risk of bias refers to the likelihood that a study's results have been systematically distorted by flaws in its design, execution, or reporting. Unlike random error (which produces unpredictable variation around the true effect), bias pushes results consistently in one direction, either overestimating or underestimating the true effect. A study with high risk of bias may reach a conclusion that appears statistically significant but does not reflect reality. [1]
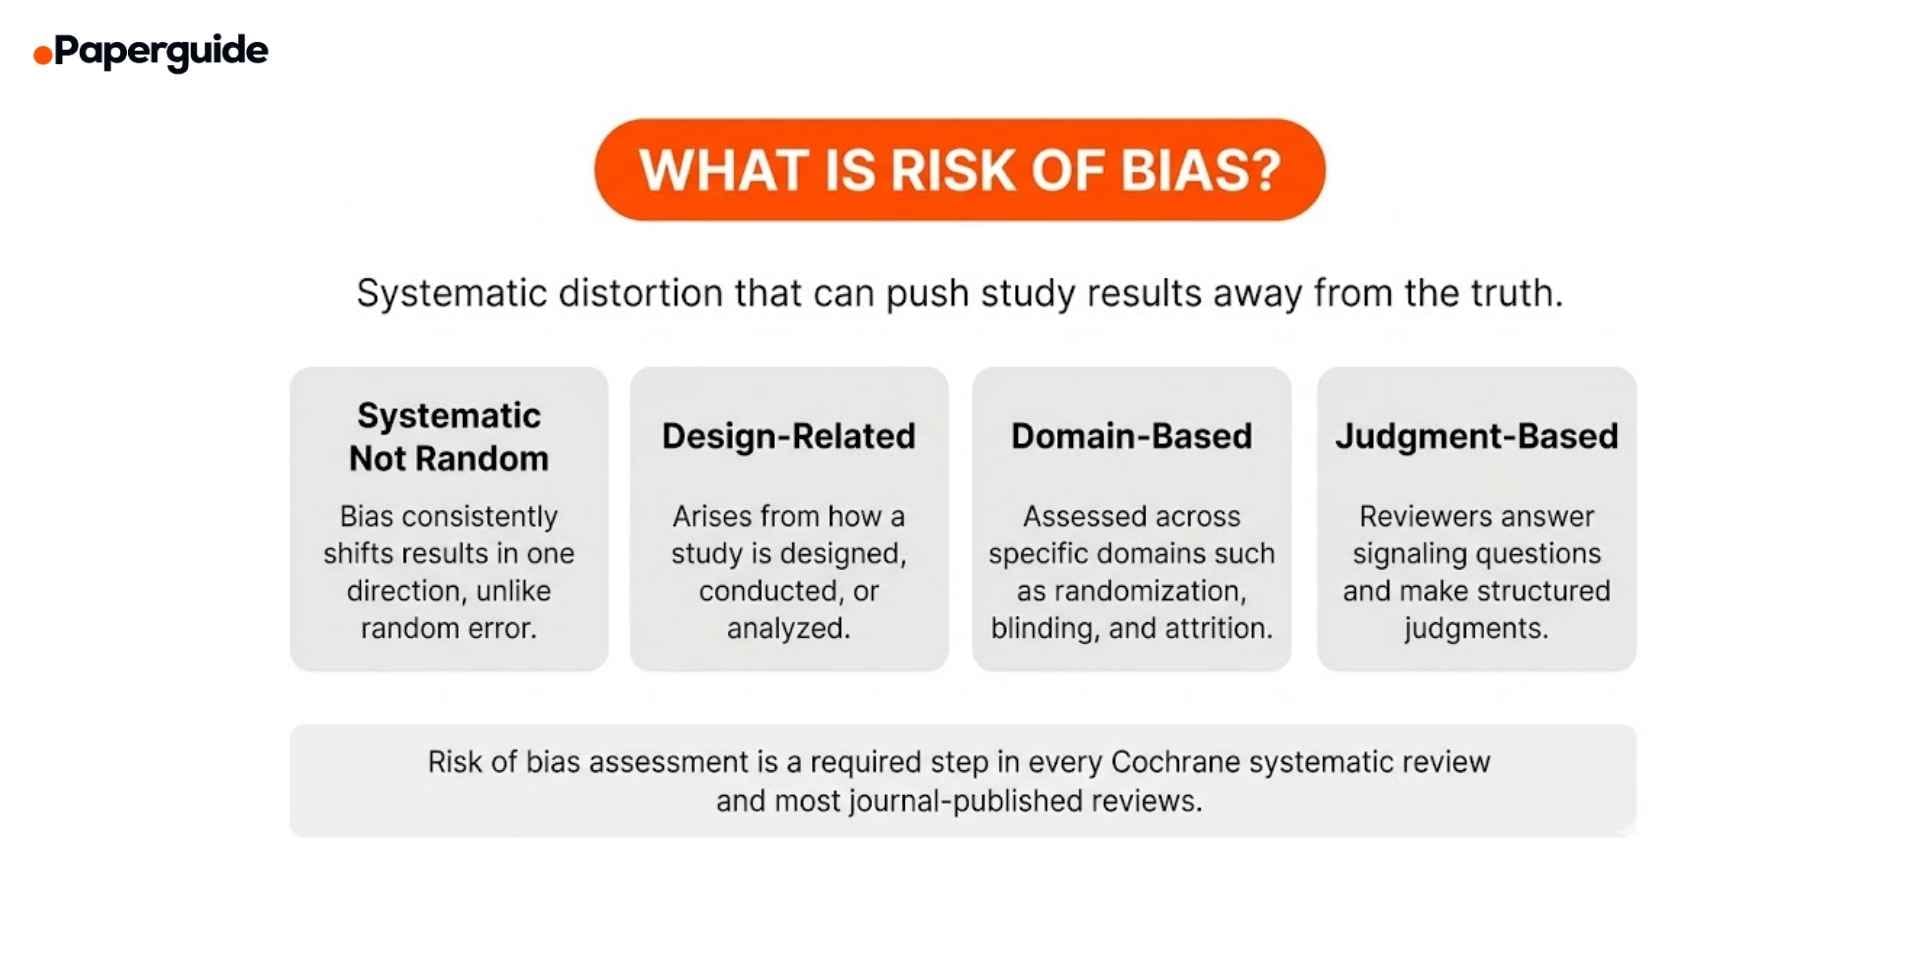
In a systematic review, risk of bias assessment serves two critical functions. First, it helps reviewers decide how much weight to give each study when synthesizing the evidence. Studies with low risk of bias contribute more reliable evidence than studies with high risk of bias, and some reviews exclude high-risk studies from meta-analysis altogether. Second, it provides transparency for readers by documenting exactly which methodological concerns were identified and how they were judged. [4]
The term "risk of bias" replaced the older concept of "study quality" because quality is a vague and multidimensional concept that conflates methodological rigor with reporting completeness and other factors. Risk of bias focuses specifically on whether the results of a study should be believed, which is the question that matters most for evidence synthesis. Researchers who regularly work with AI tools for reading and analyzing research papers can use them to quickly locate the methods sections and supplementary materials needed for thorough bias assessment.
RoB 2 vs ROBINS-I vs QUADAS-2 (Comparison)
Each of the three major risk of bias tools is designed for a different study type. Choosing the wrong tool leads to irrelevant assessments that do not address the actual sources of bias present in the study design.
| Feature | RoB 2 | ROBINS-I | QUADAS-2 |
|---|---|---|---|
| Randomized controlled trials | Non-randomized studies of interventions | Diagnostic accuracy studies | |
| Number of domains | 5 | 7 | 4 |
| Judgment categories | Low risk, Some concerns, High risk | Low, Moderate, Serious, Critical, No information | Low risk, High risk, Unclear |
| Applicability assessment | No | No | Yes (3 domains) |
| Signaling questions | Yes (per domain) | Yes (per domain) | Yes (per domain) |
| Visualization format | Traffic light plot + bar chart | Traffic light plot + bar chart | Traffic light plot + bar chart |
| Primary reference | Sterne et al. 2019 | Sterne et al. 2016 | Whiting et al. 2011 |
| Key focus | Internal validity of randomization and blinding | Confounding and selection bias in observational designs | Bias from patient selection, index test, and reference standard |
RoB 2 is the default tool for any review that includes randomized controlled trials, and Cochrane reviews are required to use it. ROBINS-I extends the assessment framework to non-randomized studies by adding domains that address confounding and participant selection, which are the primary threats to validity when randomization is absent. QUADAS-2 is specifically designed for diagnostic test accuracy reviews, where bias arises from how patients are selected, how the index test and reference standard are conducted, and whether the flow of patients through the study is appropriate [1][2][3].
How to Assess Risk of Bias
The five steps below apply to all three tools. The specific domains and signaling questions differ by tool, but the overall process remains the same: select the tool, define your assessment scope, answer signaling questions for each domain, reach domain and overall judgments, and present your results transparently.
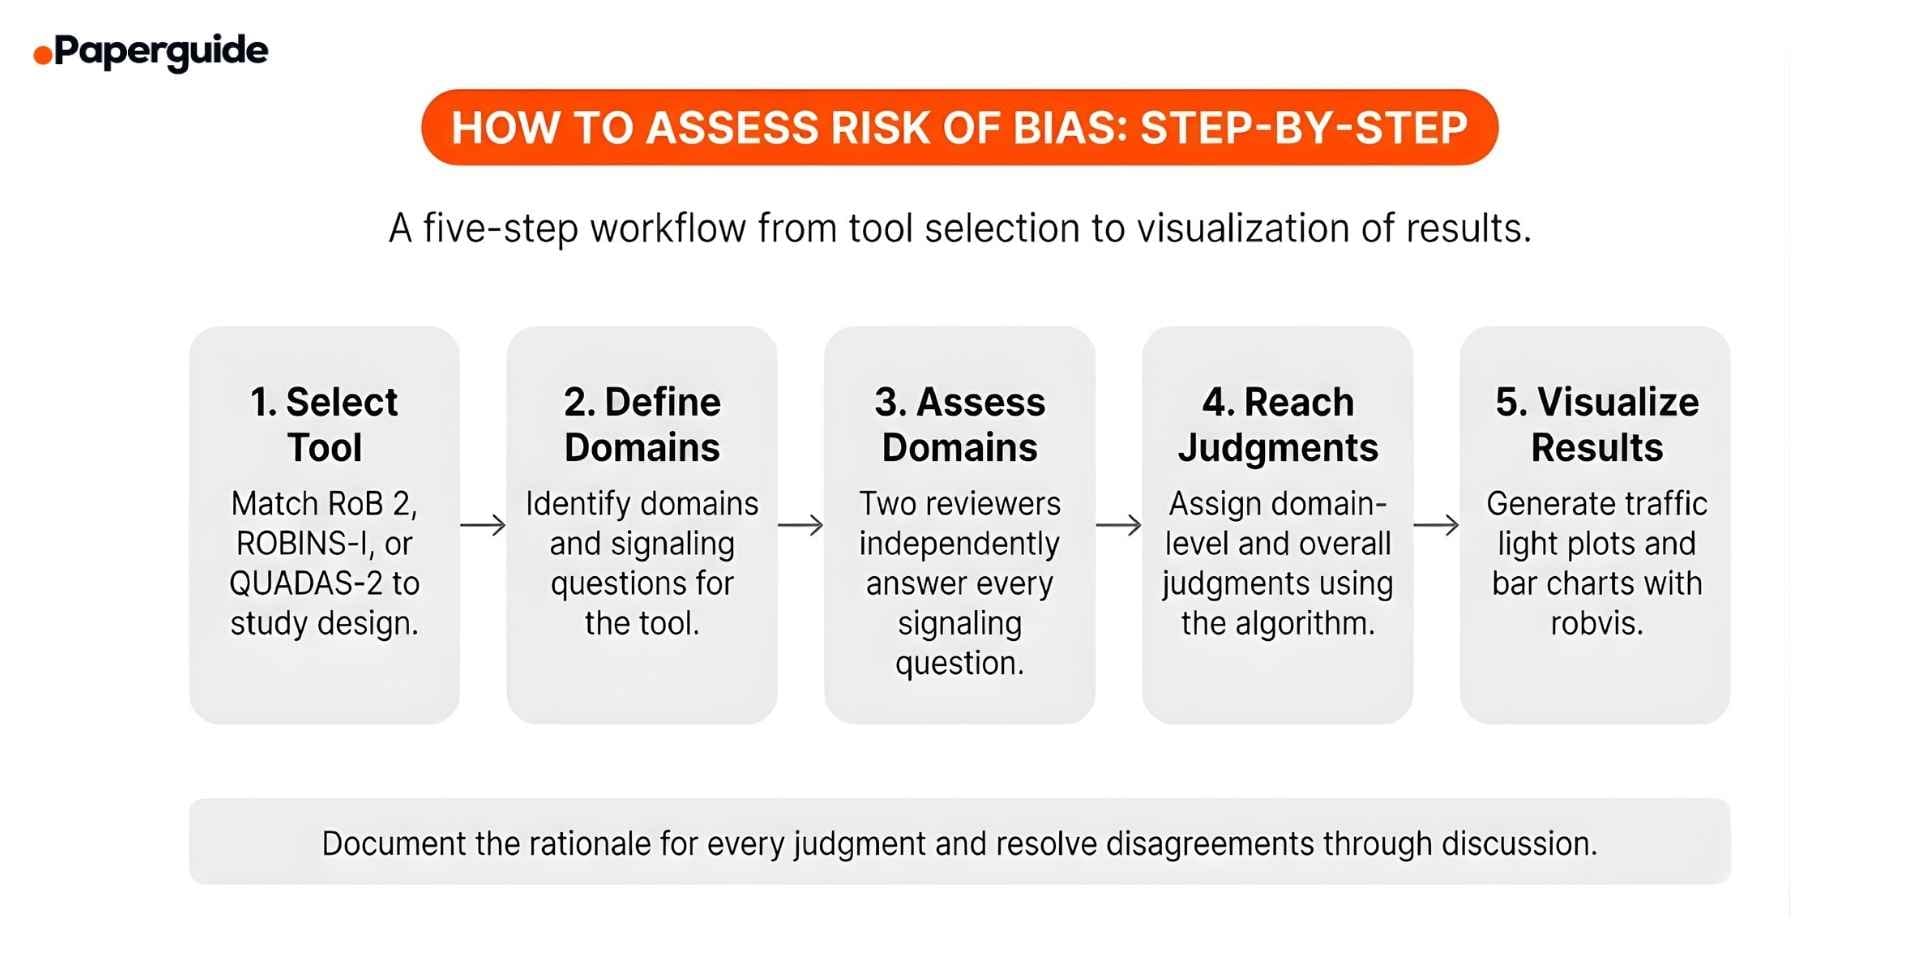
Step 1: Select the Appropriate Risk of Bias Tool
Match the tool to the study design. Use RoB 2 for randomized controlled trials (including cluster-randomized and crossover trials, which have dedicated RoB 2 variants). Use ROBINS-I for non-randomized studies that evaluate an intervention (cohort studies, case-control studies, before-after studies). Use QUADAS-2 for diagnostic test accuracy studies that compare an index test against a reference standard.
If your review includes multiple study designs, you will need to use more than one tool. For example, a mixed-methods review that includes both RCTs and observational studies would use RoB 2 for the RCTs and ROBINS-I for the observational studies. Document your tool selection and version in your review protocol.
Step 2: Define the Domains and Signaling Questions
Each tool organizes its assessment around bias domains, and each domain includes signaling questions that guide the reviewer toward a judgment. Before beginning your assessment, familiarize yourself with every domain and signaling question in the tool you are using.
RoB 2 covers 5 domains: (1) bias arising from the randomization process, (2) bias due to deviations from intended interventions, (3) bias due to missing outcome data, (4) bias in measurement of the outcome, and (5) bias in selection of the reported result. Signaling questions address whether the allocation sequence was truly random and concealed, whether participants and personnel were blinded, whether attrition was balanced and handled appropriately, whether outcome assessment could have been influenced by knowledge of allocation, and whether reported results match a pre-specified analysis plan.
ROBINS-I covers 7 domains: The first two, confounding and selection of participants into the study, address the primary threats unique to non-randomized designs. The remaining five (classification of interventions, deviations from intended interventions, missing data, measurement of outcomes, and selection of the reported result) parallel the RoB 2 framework but are adapted for observational study contexts [2].
QUADAS-2 covers 4 domains: (1) patient selection, (2) index test, (3) reference standard, and (4) flow and timing. Signaling questions examine whether enrollment was consecutive or random, whether test interpretation was blinded to other results, whether the reference standard appropriately classifies the target condition, and whether timing and patient flow were appropriate. Uniquely, the first three domains also receive a separate applicability assessment. [3]
Step 3: Assess Each Domain Using Signaling Questions
For each included study, read the full text (including supplementary materials, trial registrations, and protocols) and answer every signaling question in the relevant tool. Each signaling question typically has response options of "Yes," "Probably yes," "Probably no," "No," or "No information".
Two reviewers should independently assess each study. After independent assessment, compare results and resolve disagreements through discussion or by consulting a third reviewer. Document the rationale for every judgment, especially when the answer is not straightforward. Researchers who need to explore and narrow their research focus before beginning their review will find that defining precise PICO criteria at the protocol stage makes bias assessment significantly easier because eligibility criteria are unambiguous.
Record your responses in the official RoB 2, ROBINS-I, or QUADAS-2 Excel templates or dedicated software such as RevMan, Covidence, or the robvis Shiny web app. Consistent documentation ensures reproducibility and makes it easier to generate summary figures.
Step 4: Reach Domain-Level and Overall Judgments
After answering the signaling questions for each domain, assign a domain-level judgment using the algorithm provided in the tool's guidance document. [4]
RoB 2 uses a three-level scale: Low risk of bias (all signaling questions answered favorably), Some concerns (any question raises concern), and High risk of bias (a clear problem is identified or multiple concerns substantially lower confidence in the result).
ROBINS-I uses a four-level scale (Low, Moderate, Serious, Critical risk of bias) plus "No information," providing more granularity to reflect the wider range of bias severity in non-randomized designs.
QUADAS-2 judges each domain as "Low risk," "High risk," or "Unclear," and additionally assesses applicability concerns for the first three domains.
The overall risk of bias judgment for a study is determined by the worst domain-level judgment. In RoB 2, if any domain is judged "High risk," the overall judgment is "High risk of bias." The study is "Low risk" overall only if all domains are judged low risk.
Step 5: Visualize and Report Your Results
Present risk of bias results using traffic light plots (showing the domain-level judgment for each study) and weighted bar charts (showing the proportion of studies at each risk level for each domain). The robvis R package and accompanying Shiny web app by McGuinness and Higgins (2021) generate both figure types from RoB 2, ROBINS-I, and QUADAS-2 data. [5]
Include the traffic light plot in your manuscript (typically as a figure in the results section) and provide the full assessment data as a supplementary table. Report the number and proportion of studies at each risk level for each domain. If you conducted sensitivity analyses excluding high-risk studies, report these alongside your primary analysis.
When describing results in the text, avoid vague statements such as "most studies had some risk of bias." Instead, be specific: "Of the 24 included RCTs, 8 were judged low risk of bias, 11 had some concerns (primarily in domain 5 due to absence of a pre-registered analysis plan), and 5 were judged high risk of bias (3 due to lack of blinding in outcome assessment and 2 due to substantial missing outcome data).

Risk of Bias Assessment Examples (Worked Through)
Below are three condensed examples showing how to apply each tool to a specific study. Each example walks through the signaling questions, domain judgments, and overall judgment.
Example 1: RoB 2 Assessment of an RCT
Study: A double-blind, placebo-controlled RCT testing a mindfulness intervention on anxiety (GAD-7) in 200 students at 12 weeks. Pre-registered with published protocol.
| Domain | Key Evidence | Judgment |
|---|---|---|
| 1. Randomization | Computer-generated sequence, centralized concealment, no baseline imbalances | Low risk |
| 2. Deviations | Double-blind, no switches between groups | Low risk |
| 3. Missing data | 12% attrition (14% vs 10%), ITT with multiple imputation | Some concerns |
| 4. Outcome measurement | Validated self-report, participants blinded | Low risk |
| 5. Reported result | Matches pre-registered protocol | Low risk |
Overall: Some concerns (Domain 3). Differential attrition slightly favoring the control group warrants caution when interpreting the effect estimate.
Example 2: ROBINS-I Assessment of a Cohort Study
Study: Prospective cohort comparing surgical versus conservative management of rotator cuff tears in 450 patients, functional outcomes (Constant-Murley score) at 12 months.
| Domain | Key Evidence | Judgment |
|---|---|---|
| 1. Confounding | Age, tear size, baseline function controlled; smoking and activity not measured | Moderate |
| 2. Selection | Consecutive enrollment, but treatment based on patient/surgeon preference | Moderate |
| 3. Classification | Groups clearly defined by treatment received | Low |
| 4. Deviations | 8% conservative group crossed over to surgery, analyzed as treated | Serious |
| 5. Missing data | 15% lost to follow-up, no differential analysis | Moderate |
| 6. Outcome measurement | Assessors aware of treatment allocation | Moderate |
| 7. Reported result | No protocol registration, multiple outcomes, primary not pre-specified | Moderate |
Overall: Serious risk (Domain 4). Crossover from conservative to surgical management, analyzed as treated, may overestimate surgical benefit.
Example 3: QUADAS-2 Assessment of a Diagnostic Accuracy Study
Study: Cross-sectional study evaluating rapid antigen test for influenza versus RT-PCR in 500 emergency department patients with flu-like symptoms.
| Domain | Risk of Bias | Applicability | Key Evidence |
|---|---|---|---|
| 1. Patient selection | Low | High concern | Consecutive enrollment, but immunocompromised patients excluded |
| 2. Index test | Low | Low | Interpreted before RT-PCR results, manufacturer threshold used |
| 3. Reference standard | Low | Low | RT-PCR accepted standard, interpreted blinded to index test |
| 4. Flow and timing | Low | N/A | Same-day testing, all patients received both tests and were analyzed |
Overall: Low risk of bias, but high applicability concern for patient selection because excluding immunocompromised patients limits generalizability to this clinically important subgroup.
Risk of Bias Assessment Template
Use this template to document your assessment for each included study. Adapt the domains to match the tool you are using.
Study ID: [First author, year]
Tool used: [RoB 2 / ROBINS-I / QUADAS-2]
Outcome assessed: [Specify the outcome and time point for this assessment]
Domain 1: [Domain name]. Signaling question responses: [list]. Judgment: [Low / Some concerns / High risk]. Rationale: [Brief explanation].
Domain 2: [Domain name]. Signaling question responses: [list]. Judgment: [Low / Some concerns / High risk]. Rationale: [Brief explanation].
Domain 3: [Domain name]. Signaling question responses: [list]. Judgment: [Low / Some concerns / High risk]. Rationale: [Brief explanation].
Domain 4: [Domain name]. Signaling question responses: [list]. Judgment: [Low / Some concerns / High risk]. Rationale: [Brief explanation].
Domain 5: [Domain name]. Signaling question responses: [list]. Judgment: [Low / Some concerns / High risk]. Rationale: [Brief explanation].
Overall judgment: [Low risk / Some concerns / High risk]. Rationale: [Summary of key concerns].
Notes: [Any additional observations, discrepancies resolved, or information gaps].
Filled Example:
Study ID: Chen, 2024.
Tool used: RoB 2.
Outcome assessed: Anxiety symptoms (GAD-7) at 12 weeks.
Domain 1: Randomization process. Signaling questions: Yes, Yes, No. Judgment: Low risk. Rationale: Computer-generated sequence with centralized concealment and no baseline imbalances.
Domain 2: Deviations from intended interventions. Signaling questions: No, No, NA. Judgment: Low risk. Rationale: Double-blind design with no reported switches.
Domain 3: Missing outcome data. Signaling questions: Probably no, Probably yes. Judgment: Some concerns. Rationale: 12% attrition with slight differential (14% vs 10%). ITT with multiple imputation was used, but differential dropout raises minor concern.
Domain 4: Measurement of the outcome. Signaling questions: No, No, No. Judgment: Low risk. Rationale: Validated self-report measure with blinded participants.
Domain 5: Selection of the reported result. Signaling questions: Yes, No. Judgment: Low risk. Rationale: Pre-registered protocol with matching reported outcomes.
Overall judgment: Some concerns. Rationale: Differential attrition in Domain 3 introduces minor uncertainty, but all other domains are low risk.
Notes: Assessment based on published paper, supplementary materials, and trial registry entry. No discrepancies between reviewers.
Risk of Bias Assessment Examples
Example 1: RoB 2 Assessment of an RCT
Study: A double-blind, placebo-controlled RCT testing a mindfulness intervention on anxiety (GAD-7) in 200 students at 12 weeks. Pre-registered with published protocol.
| Domain | Key Evidence | Judgment |
|---|---|---|
| 1. Randomization | Computer-generated sequence, centralized concealment, no baseline imbalances | Low risk |
| 2. Deviations | Double-blind, no switches between groups | Low risk |
| 3. Missing data | 12% attrition (14% vs 10%), ITT with multiple imputation | Some concerns |
| 4. Outcome measurement | Validated self-report, participants blinded | Low risk |
| 5. Reported result | Matches pre-registered protocol | Low risk |
Overall: Some concerns (Domain 3). Differential attrition slightly favoring the control group warrants caution when interpreting the effect estimate.
Example 2: ROBINS-I Assessment of a Cohort Study
Study: Prospective cohort comparing surgical versus conservative management of rotator cuff tears in 450 patients, functional outcomes (Constant-Murley score) at 12 months.
| Domain | Key Evidence | Judgment |
|---|---|---|
| 1. Confounding | Age, tear size, baseline function controlled; smoking and activity not measured | Moderate |
| 2. Selection | Consecutive enrollment, but treatment based on patient/surgeon preference | Moderate |
| 3. Classification | Groups clearly defined by treatment received | Low |
| 4. Deviations | 8% conservative group crossed over to surgery, analyzed as treated | Serious |
| 5. Missing data | 15% lost to follow-up, no differential analysis | Moderate |
| 6. Outcome measurement | Assessors aware of treatment allocation | Moderate |
| 7. Reported result | No protocol registration, multiple outcomes, primary not pre-specified | Moderate |
Overall: Serious risk (Domain 4). Crossover from conservative to surgical management, analyzed as treated, may overestimate surgical benefit.
Example 3: QUADAS-2 Assessment of a Diagnostic Accuracy Study
Study: Cross-sectional study evaluating rapid antigen test for influenza versus RT-PCR in 500 emergency department patients with flu-like symptoms.
| Domain | Risk of Bias | Applicability | Key Evidence |
|---|---|---|---|
| 1. Patient selection | Low | High concern | Consecutive enrollment, but immunocompromised patients excluded |
| 2. Index test | Low | Low | Interpreted before RT-PCR results, manufacturer threshold used |
| 3. Reference standard | Low | Low | RT-PCR accepted standard, interpreted blinded to index test |
| 4. Flow and timing | Low | N/A | Same-day testing, all patients received both tests and were analyzed |
Overall: Low risk of bias, but high applicability concern for patient selection because excluding immunocompromised patients limits generalizability to this clinically important subgroup.
Common Mistakes in Risk of Bias Assessment
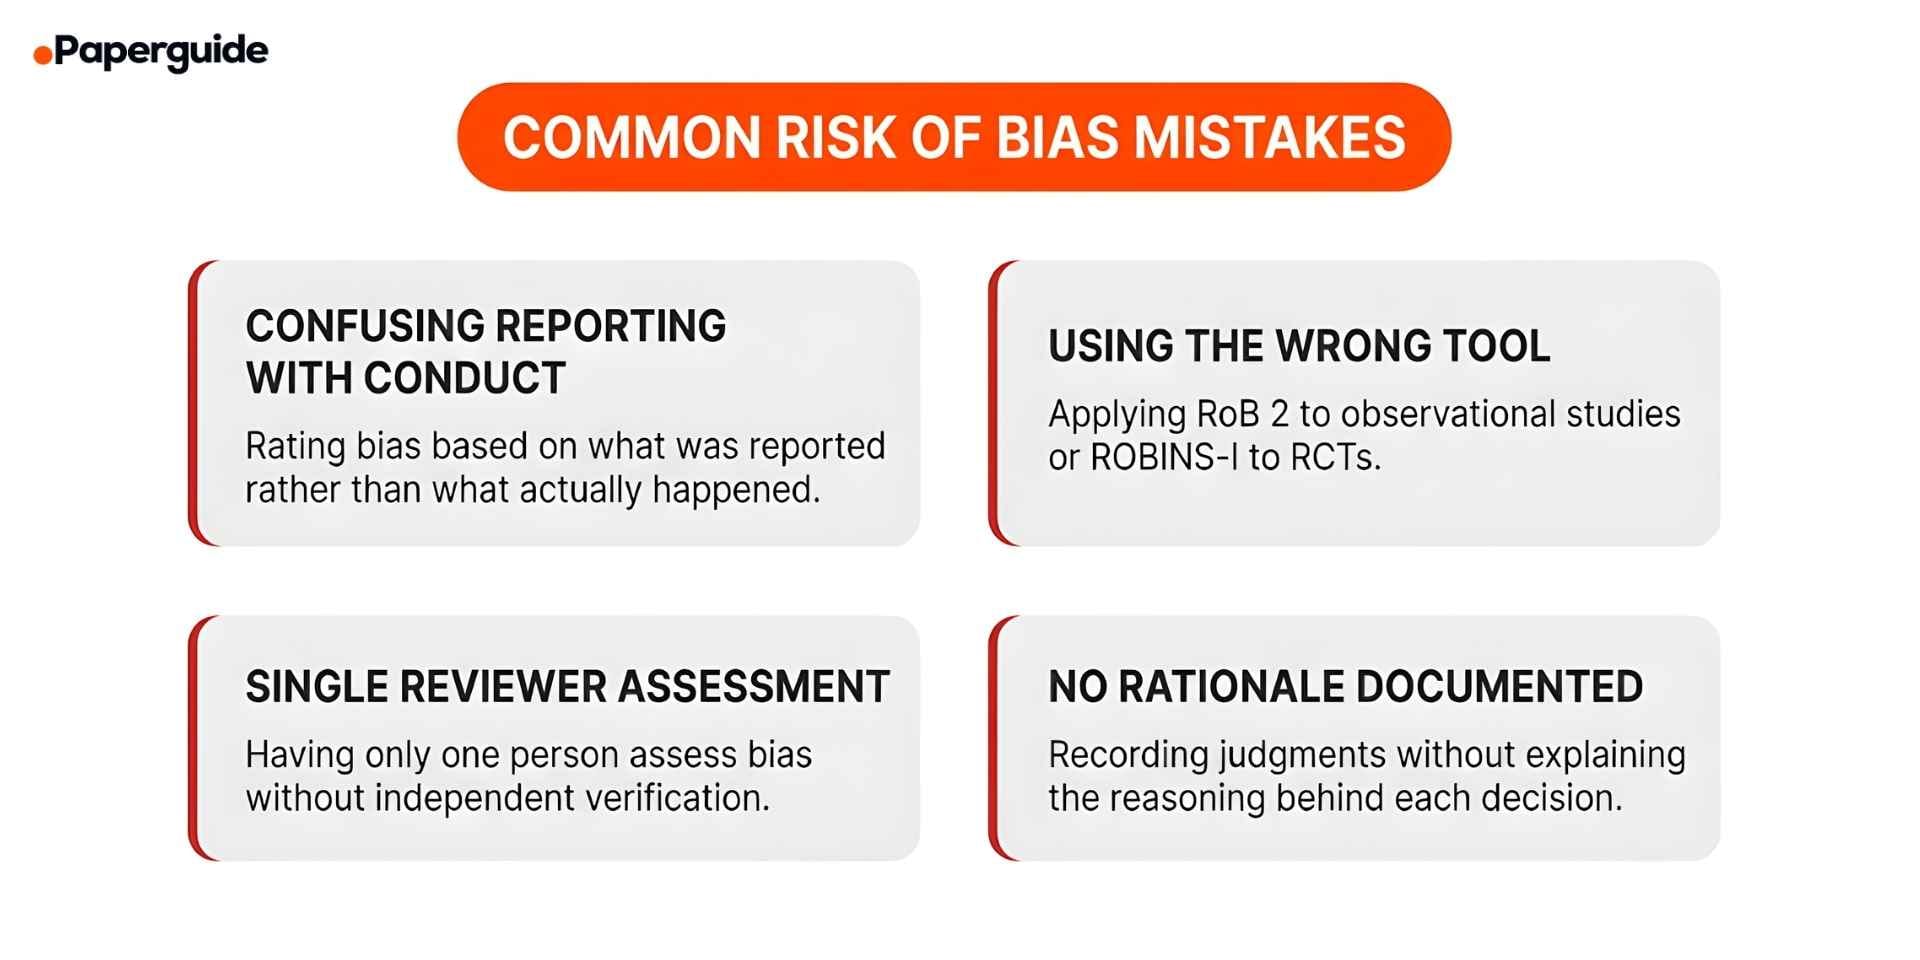
Mistake 1: Confusing Reporting Quality with Risk of Bias
Risk of bias is about what actually happened in the study, not how well the authors described it. If a paper does not report allocation concealment, the correct signaling question response is "No information," not "High risk." Always check supplementary materials, trial registrations, and published protocols before judging. Contact study authors when details are genuinely unavailable rather than assuming the worst [1].
Mistake 2: Applying the Wrong Tool to the Study Design
Using RoB 2 for a cohort study or ROBINS-I for a randomized trial produces irrelevant assessments because the domains do not match the actual sources of bias. Always verify the study design before selecting the tool. If a study describes itself as an RCT but did not truly randomize participants, assess it using ROBINS-I rather than RoB 2.
Mistake 3: Conducting Assessment with a Single Reviewer
Risk of bias assessment involves subjective judgments, and inter-rater agreement is often moderate even among trained reviewers. Two reviewers should independently assess every study, compare results, calculate inter-rater agreement (Cohen's kappa), and resolve disagreements through discussion or a third reviewer. Document the resolution process. [5]
Mistake 4: Not Documenting the Rationale for Judgments
Recording "High risk" or "Low risk" without explaining why is insufficient. For every domain judgment, write a brief rationale citing specific evidence from the study, for example: "High risk because outcome assessors were not blinded and the outcome relies on subjective patient-reported measures." Check the trial registry (ClinicalTrials.gov, ISRCTN, PROSPERO), supplementary files, and any published protocol papers to support your reasoning. Compare the registered protocol to published results to identify selective outcome reporting. Managing these detailed assessments across many studies is easier when researchers have access to strong reference management tools that can store notes and annotations alongside each source.
Risk of Bias Assessment Quality Checklist
- [ ] Correct tool selected. RoB 2 for RCTs, ROBINS-I for non-randomized intervention studies, QUADAS-2 for diagnostic accuracy studies.
- [ ] All domains assessed. Every domain in the selected tool has been evaluated for every included study.
- [ ] Signaling questions answered. All signaling questions within each domain have been answered using the response options specified in the tool guidance.
- [ ] Two independent reviewers. At least two reviewers independently assessed each study, and disagreements were resolved through discussion or arbitration.
- [ ] Rationale documented. A written rationale accompanies every domain-level judgment, citing specific evidence from the study.
- [ ] Supplementary sources checked. Trial registrations, protocols, and supplementary materials were consulted in addition to the main published paper.
- [ ] Overall judgment derived correctly. The overall risk of bias judgment follows the algorithm specified in the tool (worst domain determines the overall rating in RoB 2).
- [ ] Traffic light plot generated. A traffic light plot and/or weighted bar chart has been created to visualize domain-level and overall results.
- [ ] Results integrated into synthesis. Risk of bias findings are used to inform sensitivity analyses, subgroup analyses, or GRADE certainty of evidence assessments.
- [ ] Assessment is outcome-specific. For studies reporting multiple outcomes, separate assessments were conducted for each outcome included in the review.
When to Use RoB 2, ROBINS-I, or QUADAS-2
The choice between the three tools depends entirely on the study designs included in your systematic review and the type of question you are answering.
Use RoB 2 when your review includes randomized controlled trials. This covers individually randomized parallel-group trials as well as cluster-randomized trials and crossover trials (which have dedicated RoB 2 variants). RoB 2 is mandatory for Cochrane reviews and is the standard expectation for any systematic review published in a major medical journal.
Use ROBINS-I when your review includes non-randomized studies that evaluate the effect of an intervention. This includes prospective and retrospective cohort studies, case-control studies, interrupted time series, and controlled before-after studies. ROBINS-I is appropriate when you are comparing the outcomes of groups that received different interventions but were not randomized to those groups. [2]
Use QUADAS-2 when your review evaluates the accuracy of a diagnostic test, screening test, or clinical prediction tool by comparing it against a reference standard. QUADAS-2 is the only one of the three tools that includes an applicability assessment, reflecting the fact that diagnostic accuracy can vary substantially across clinical settings and patient populations. [3]
If your review includes both RCTs and observational studies, use RoB 2 for the trials and ROBINS-I for the observational studies. Present the assessments separately. Researchers who are exploring academic writing support tools for their review will find that structuring the risk of bias section clearly, with separate tables for each tool, improves both the writing process and the readability of the final manuscript.
Validate This With Papers (2 Minutes)
Before finalizing your risk of bias assessment, verify that your approach meets the methodological standards expected by systematic review guidelines and journal peer reviewers.
Step 1: Check that your assessment follows the latest version of the tool guidance. RoB 2 was published by Sterne and colleagues in 2019, ROBINS-I by Sterne and colleagues in 2016, and QUADAS-2 by Whiting and colleagues in 2011. The Cochrane Handbook (Version 6.5, 2024) provides the most up-to-date implementation guidance for all three tools.
Step 2: Use Paperguide's Literature Review AI to search for recent methodological papers discussing risk of bias assessment practices, common errors, and updated guidance for the specific tool you are using. This helps you identify any recent refinements or best practices that may have been published since the original tool guidance.
Step 3: Review the text of your domain-level rationales for clarity and completeness. Paperguide's Sentence Summarizer can help you condense lengthy rationale text into clear, precise statements that communicate your reasoning without unnecessary detail.
This takes about two minutes and helps ensure your risk of bias assessment is rigorous, transparent, and aligned with current best practice.
Conclusion
Risk of bias assessment is the step that separates a credible systematic review from one that simply collects and reports study findings without evaluating their reliability. By using the appropriate tool for each study design, answering every signaling question with evidence, documenting your rationale, and presenting results with standardized visualizations, you produce an assessment that readers and peer reviewers can trust. The three tools covered in this guide, RoB 2 for randomized trials, ROBINS-I for non-randomized studies, and QUADAS-2 for diagnostic accuracy studies, together cover the vast majority of study designs included in systematic reviews across all health and social science fields.
The quality of your risk of bias assessment depends on three factors: knowing the tool well enough to apply it consistently, having access to the full range of study documents (published paper, supplementary materials, trial registration, and protocol), and using two independent reviewers to minimize subjective judgment errors. Researchers who invest the time to conduct thorough, well-documented assessments contribute not only to the strength of their own review but also to the broader evidence base that clinicians, policymakers, and other researchers rely on to make informed decisions. Tools such as writing strategy guides can help early-career researchers develop the structured analytical writing skills needed to communicate bias assessment findings clearly and persuasively.
Frequently Asked Questions
What is the difference between risk of bias and study quality?
Risk of bias focuses specifically on whether the design, conduct, or analysis of a study may have systematically distorted its results. Study quality is a broader and vaguer concept that can include reporting quality, sample size, statistical sophistication, and other factors that do not necessarily indicate whether the results are trustworthy. The Cochrane Collaboration moved away from "quality" assessments to risk of bias assessments precisely because quality checklists often conflated reporting with conduct and produced scores that were difficult to interpret.
Can I use a single risk of bias tool for all study designs?
No. Each tool is designed for a specific study design, and the domains reflect the sources of bias relevant to that design. RoB 2 does not assess confounding because randomization controls for it. ROBINS-I includes confounding because non-randomized studies are vulnerable to it. Using the wrong tool produces an assessment that misses the most important sources of bias while evaluating irrelevant ones.
How do I handle missing information when assessing risk of bias?
First, check supplementary materials, trial registrations, and published protocols. If the information is still unavailable, contact the study authors. If you cannot obtain the information, use the "No information" response option where available (ROBINS-I provides this explicitly). In RoB 2, when information is missing and you cannot determine whether bias is present, the appropriate response is typically "No information" for signaling questions, which usually leads to a "Some concerns" domain judgment
Should risk of bias be assessed for every outcome in a study?
Yes, ideally. Risk of bias can differ across outcomes within the same study. For example, an RCT may have low risk of bias for an objectively measured primary outcome but high risk for a subjective secondary outcome where blinding was inadequate. RoB 2 explicitly requires outcome-specific assessment. In practice, reviewers typically assess bias for each outcome included in their review's synthesis.
What is inter-rater reliability and why does it matter for bias assessment?
Inter-rater reliability measures the degree to which two independent reviewers agree on their risk of bias judgments. It is typically reported as Cohen's kappa or percentage agreement. Moderate to high agreement (kappa above 0.6) suggests the assessment is being applied consistently, while low agreement may indicate that reviewers need additional training or that the assessment criteria are being interpreted differently.
How do I integrate risk of bias results into my evidence synthesis?
There are several approaches. You can conduct sensitivity analyses that exclude high-risk studies and compare results with and without them. You can present meta-analyses stratified by risk of bias level. You can use risk of bias judgments as input into GRADE (Grading of Recommendations, Assessment, Development and Evaluations) assessments, where risk of bias is one of five factors that determine the certainty of evidence. The approach you choose should be specified in your review protocol.
Is ROBINS-I the same as the Newcastle-Ottawa Scale?
No. ROBINS-I and the Newcastle-Ottawa Scale (NOS) both assess non-randomized studies, but they use fundamentally different approaches. ROBINS-I uses a domain-based framework with signaling questions, modeled after RoB 2, and produces structured judgments. The NOS uses a star-based scoring system. ROBINS-I is generally considered more rigorous and transparent because it requires reviewers to document their reasoning for each domain rather than simply awarding stars.
References
- Sterne, J.A.C. et al. "RoB 2: A Revised Tool for Assessing Risk of Bias in Randomised Trials." BMJ, 366, l4898, 2019.
- Sterne, J.A.C. et al. "ROBINS-I: A Tool for Assessing Risk of Bias in Non-Randomised Studies of Interventions." BMJ, 355, i4919, 2016.
- Whiting, P.F. et al. "QUADAS-2: A Revised Tool for the Quality Assessment of Diagnostic Accuracy Studies." Annals of Internal Medicine, 155(8), 529-536, 2011.
- Higgins, J.P.T., Thomas, J., Chandler, J., Cumpston, M., Li, T., Page, M.J. et al. "Cochrane Handbook for Systematic Reviews of Interventions." Version 6.5, Cochrane, 2024.
- McGuinness, L.A. & Higgins, J.P.T. "Risk-of-bias VISualization (robvis): An R Package and Shiny Web App for Visualizing Risk-of-Bias Assessments." Research Synthesis Methods, 12, 55-61, 2021.