
Types of Bias in Research: Examples and How to Reduce Them

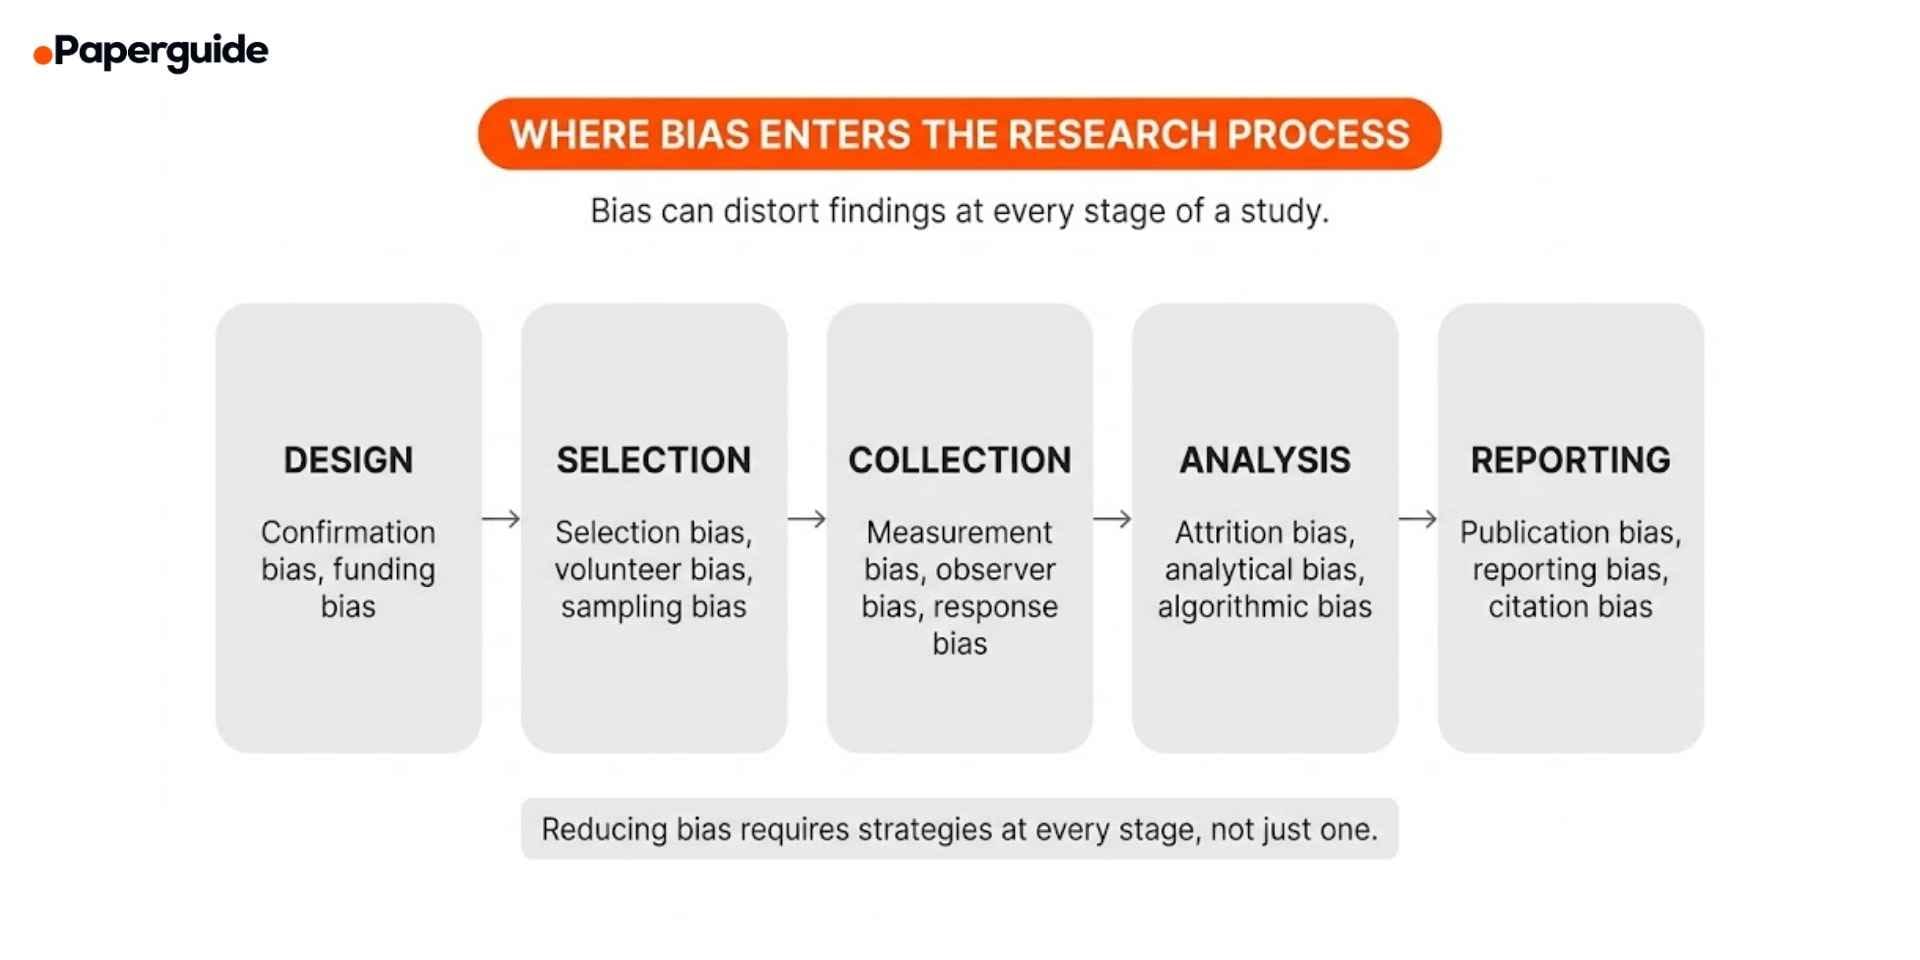
Bias in research is any systematic error that distorts findings away from the true result. It can enter a study at every stage, from how participants are selected and how data is collected to how results are analyzed and reported. Unlike random error, which averages out with larger samples, bias pushes results consistently in one direction, producing conclusions that look valid but are fundamentally misleading.
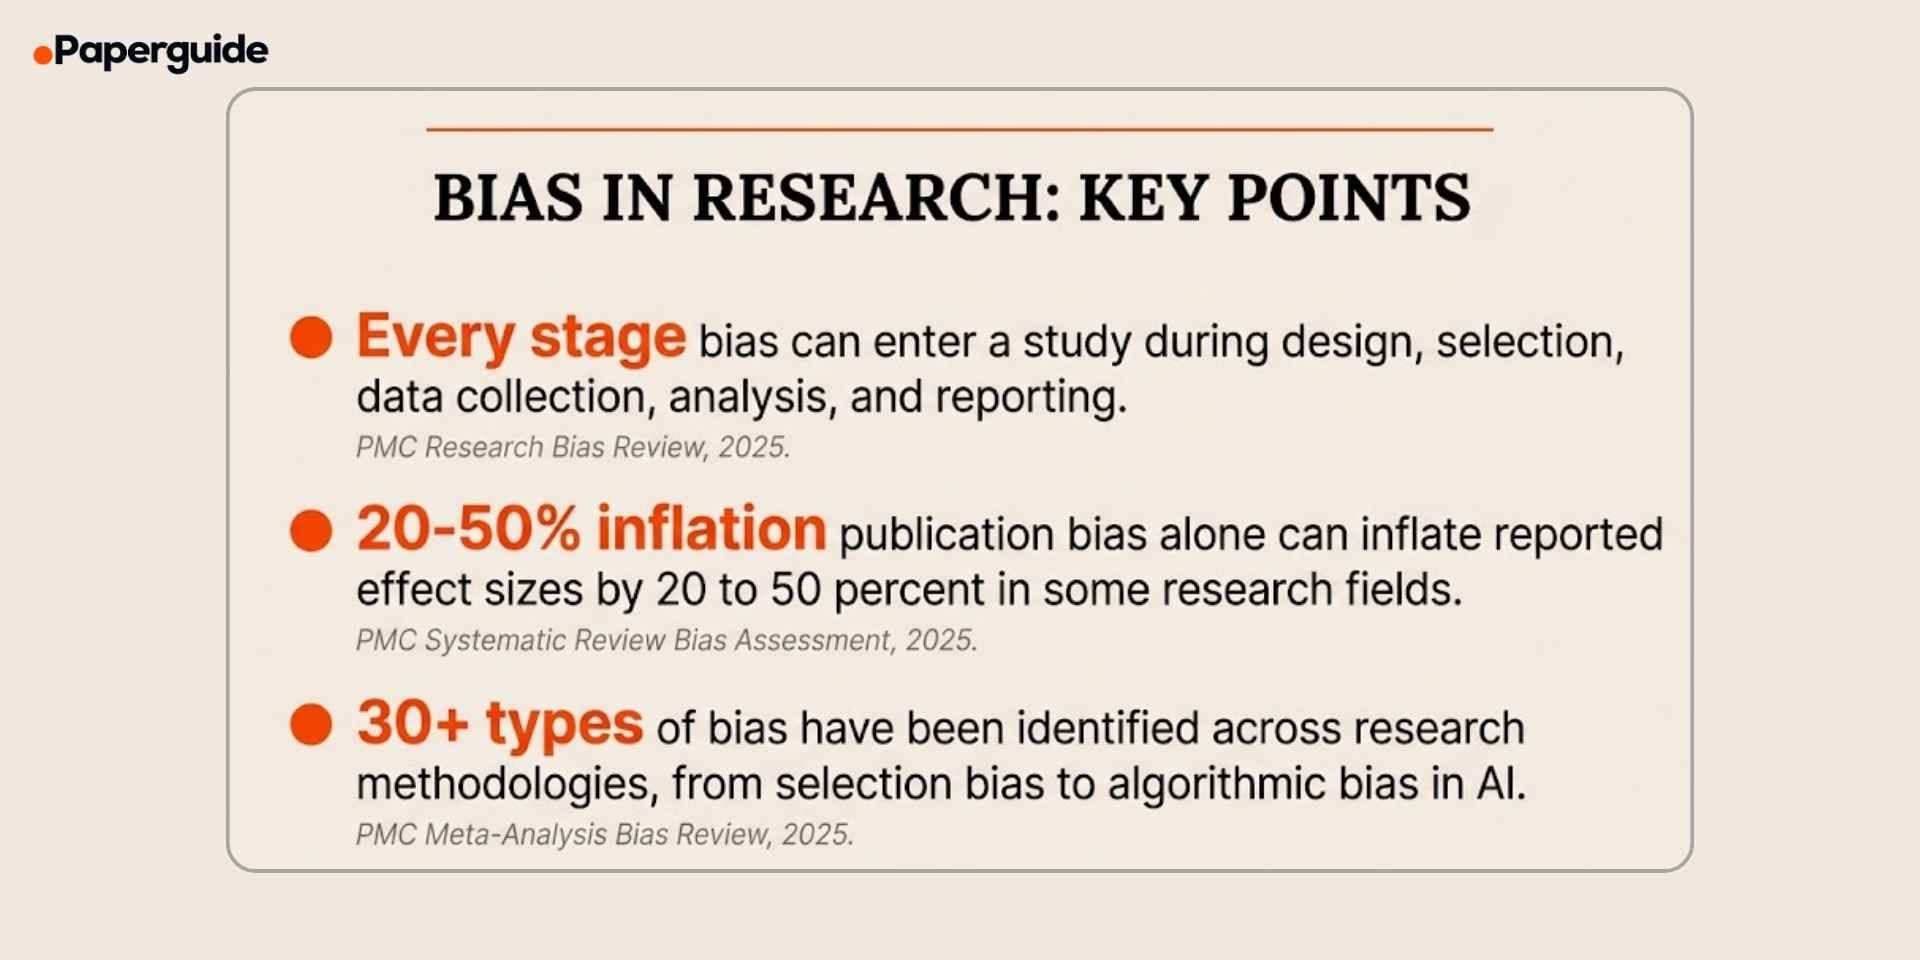
A 2025 review found that bias can occur at each stage of the research process, from study design, participant selection, data collection and analysis, to the interpretation and reporting of findings, and that researchers frequently underestimate the cumulative effect of multiple small biases operating simultaneously. A separate 2025 systematic review of biases in systematic reviews and meta-analyses identified over 30 distinct types of bias and found that publication bias alone can inflate effect sizes by 20% to 50% in some fields. [1] [2]
This guide explains the major types of bias in research, provides examples across disciplines, and covers practical strategies for reducing bias at each stage of the research process.
Key Takeaways
- Bias is a systematic error that distorts research findings in one direction, unlike random error which averages out with larger samples.
- The most common types include selection bias, confirmation bias, measurement bias, observer bias, response bias, attrition bias, and publication bias.
- Bias can enter at every stage of research: design, participant selection, data collection, analysis, interpretation, and reporting. [1]
- Publication bias alone can inflate effect sizes by 20% to 50% in some fields, making positive findings appear stronger than they actually are. [2]
- AI and machine learning are introducing new forms of algorithmic bias that reflect and amplify biases present in training data. [3]
- Most biases can be reduced through careful study design, blinding, randomization, pre-registration, and transparent reporting.
What Is Bias in Research?
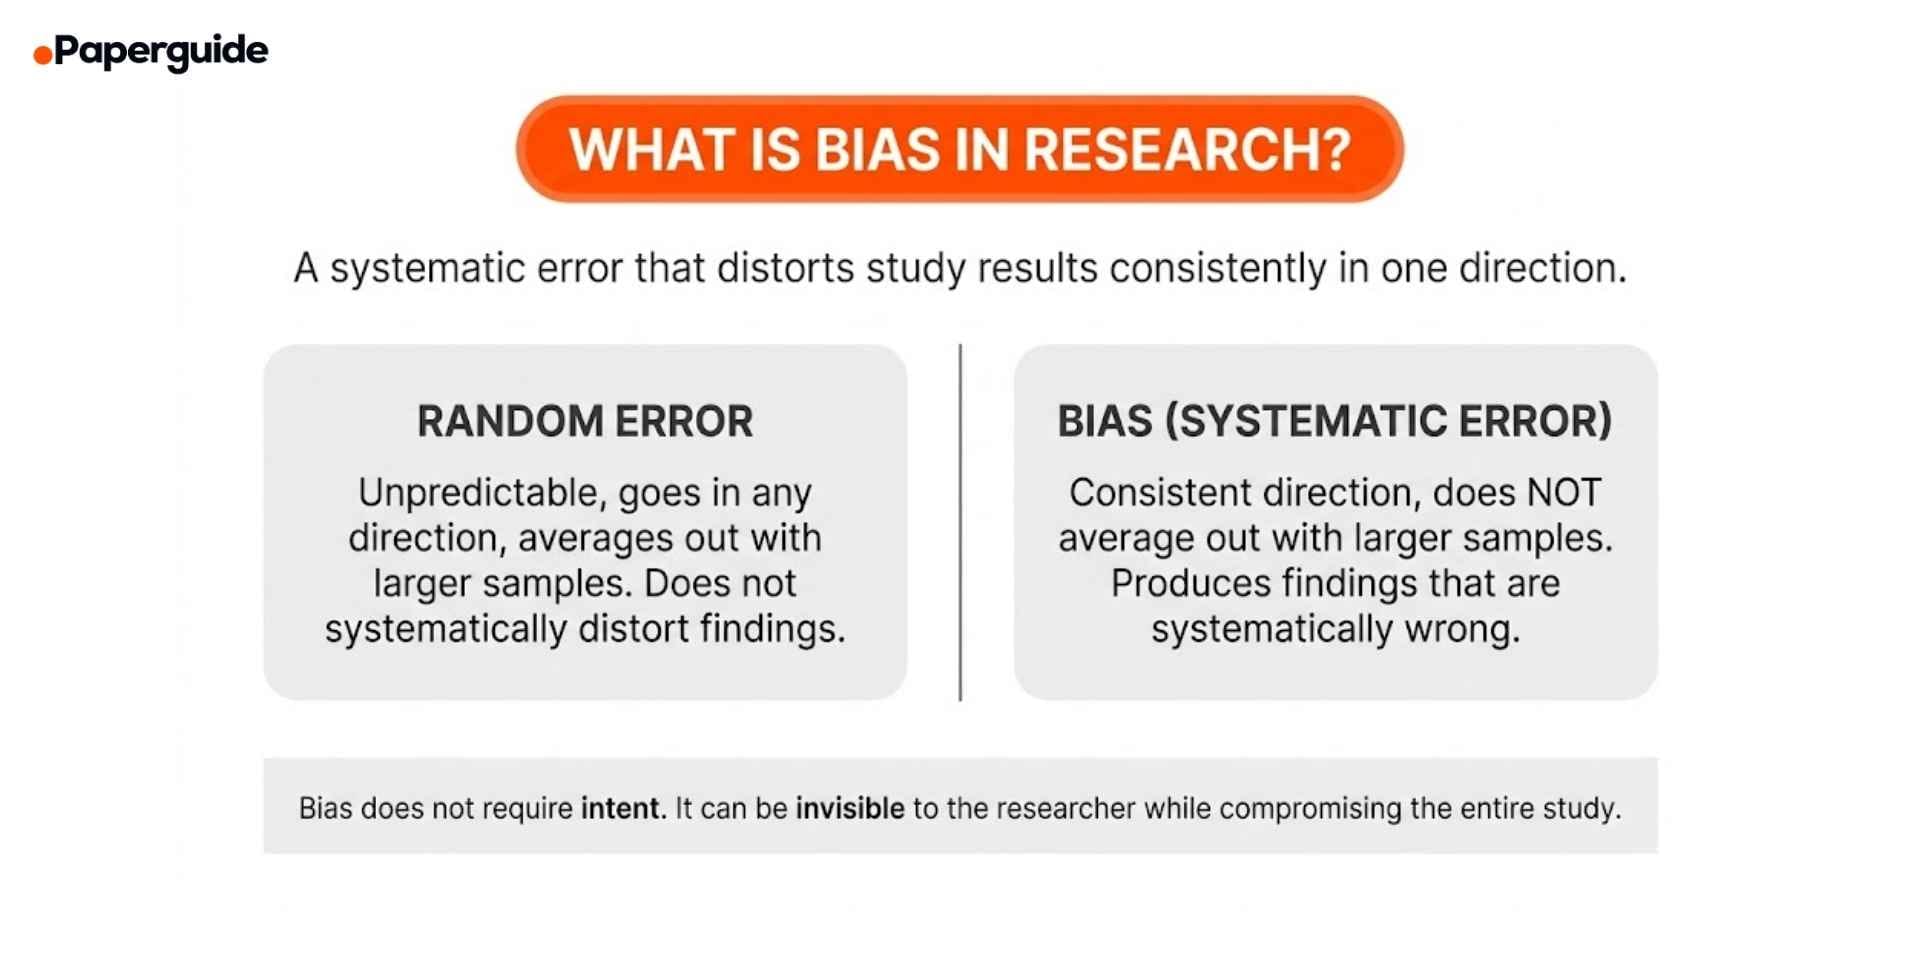
Bias in research is any systematic deviation from the truth that distorts the results of a study. It differs from random error in a critical way: random error is unpredictable and can go in any direction, averaging out across a large enough sample. Bias, by contrast, consistently pushes results in one direction, producing findings that systematically overestimate or underestimate the true effect.
Bias does not require intent. A researcher can introduce bias without realizing it, through the way they recruit participants, word their survey questions, record observations, or choose which results to highlight. This is what makes bias particularly dangerous: it can be invisible to the researcher while fundamentally compromising the validity of the study.
The consequences of undetected bias extend far beyond individual studies. Biased findings influence clinical guidelines, policy decisions, educational practices, and public understanding of research. When multiple biased studies are synthesized in meta-analyses, the bias is not corrected but amplified, producing conclusions that appear robust because they are consistent, when in reality they are consistently wrong.
Types of Bias in Research
Selection Bias
Selection bias occurs when the participants included in a study are not representative of the target population. This can happen through non-random sampling, self-selection (volunteer bias), or differential recruitment across study groups.
Example: A study on workplace mental health distributes surveys only to employees who attend an optional wellness seminar. Participants who attend are likely more health-conscious and engaged than those who do not, producing results that overestimate overall workplace well-being.
How to reduce it: Use random sampling when possible. Define clear inclusion and exclusion criteria before recruitment begins. Report participation rates and compare the characteristics of participants with non-participants to assess the direction and magnitude of potential selection bias.
Confirmation Bias
Confirmation bias is the tendency to search for, interpret, and prioritize information that supports existing beliefs or hypotheses while ignoring or dismissing contradictory evidence. It affects every stage of research, from literature review through data interpretation.
Example: A researcher who believes social media harms adolescent mental health designs a study that measures only negative outcomes (anxiety, depression) without measuring potential positive outcomes (social connection, identity development). The study design itself reflects the researcher's pre-existing belief.
How to reduce it: Pre-register your hypotheses and analysis plan before data collection. Actively search for and engage with evidence that contradicts your hypothesis. Use blinded analysis where the analyst does not know which group is the treatment group. Include both positive and negative outcome measures.
Measurement Bias (Information Bias)
Measurement bias occurs when the instruments or procedures used to collect data systematically produce inaccurate readings. This includes poorly calibrated instruments, ambiguously worded survey questions, and inconsistent data recording procedures.
Example: A health survey asks participants "How many servings of vegetables do you eat per day?" without defining what constitutes a "serving." Participants interpret the question differently, with some counting a handful of spinach as one serving and others counting an entire salad as one serving. The inconsistency produces unreliable data.
How to reduce it: Use validated instruments with established psychometric properties. Pilot test all measurement tools before full deployment. Provide clear definitions for all terms. Standardize data collection procedures across all research sites and time points. Choosing the right research instruments with documented validity and reliability evidence is one of the most effective ways to prevent measurement bias.
Observer Bias (Researcher Bias)
Observer bias occurs when the researcher's expectations or beliefs influence how they record or interpret data. It is particularly common in studies where the researcher is directly involved in data collection, such as observation studies, clinical assessments, or qualitative coding.
Example: A clinical researcher who knows which patients received the experimental drug rates their symptoms as more improved than a blinded assessor would. The researcher's knowledge of group assignment unconsciously influences their clinical judgment.
How to reduce it: Use blinding wherever possible. In clinical trials, double-blind designs prevent both the participant and the assessor from knowing group assignment. In qualitative research, use multiple coders and calculate inter-rater reliability. In observation studies, use structured observation protocols with pre-defined coding categories.
Response Bias
Response bias occurs when participants systematically provide inaccurate responses. Common forms include social desirability bias (giving answers that appear socially acceptable), acquiescence bias (tendency to agree with statements regardless of content), and recall bias (inaccurate memory of past events).
Example: A survey on alcohol consumption consistently underestimates actual drinking because participants underreport their intake to avoid appearing unhealthy. Studies using biomarker verification have found that self-reported alcohol consumption can underestimate actual consumption by 40% to 60%.
How to reduce it: Use anonymous data collection to reduce social desirability pressure. Include reverse-scored items to detect acquiescence bias. Use validated instruments with built-in checks for response consistency. For recall-dependent measures, shorten the recall period or use ecological momentary assessment (real-time data collection).
Attrition Bias
Attrition bias occurs when participants who drop out of a study differ systematically from those who remain. If dropout is related to the outcome being studied, the remaining sample no longer represents the original population, and results are biased.
Example: In a 12-month weight loss trial, participants who lose the least weight are most likely to drop out. The final sample includes only the most successful participants, making the intervention appear more effective than it actually is. This is called "completer analysis" bias.
How to reduce it: Use intention-to-treat analysis, which includes all originally randomized participants regardless of whether they completed the study. Track and report dropout rates by group. Compare baseline characteristics of completers and non-completers. Use multiple imputation or other statistical methods to account for missing data.
Publication Bias
Publication bias occurs when studies with positive or statistically significant results are more likely to be published than studies with null or negative results. This distorts the available evidence by overrepresenting positive findings.
Example: Ten laboratories independently test whether a new teaching method improves test scores. Two find significant effects and publish their results. Eight find no effect and do not publish. The published literature suggests the method works, even though 80% of the evidence says otherwise. The 2025 systematic review found that publication bias can inflate reported effect sizes by 20% to 50% in some research areas. [2]
How to reduce it: Pre-register studies before data collection so that null results are documented. Submit to journals that publish null findings. Search grey literature (dissertations, conference proceedings, pre-prints) when conducting systematic reviews. Use funnel plots and statistical tests for publication bias when conducting meta-analyses.
Algorithmic Bias
Algorithmic bias is a newer form of bias that occurs when machine learning models and AI systems produce systematically unfair or inaccurate outputs because of biases in their training data, model design, or deployment context. A 2025 review on bias in AI healthcare applications found six major bias types in electronic health record-based models: algorithmic, confounding, implicit, measurement, selection, and temporal bias. [3]
Example: A predictive model trained on historical hospital data to identify patients at risk of readmission performs less accurately for minority populations because the training data underrepresents these groups. The model's predictions reflect and amplify the disparities present in the original data.
How to reduce it: Audit training datasets for representativeness. Test model performance across demographic subgroups. Use fairness metrics alongside performance metrics. A 2025 systematic review on bias mitigation in generative AI found that most effective strategies involve interventions at the data preprocessing stage, including resampling and reweighting techniques. [4]
Comparison of Bias Types
| Bias Type | Stage | Cause | Primary Reduction Strategy |
|---|---|---|---|
| Selection Bias | Recruitment | Non-representative sampling | Random sampling, clear criteria |
| Confirmation Bias | Design and Analysis | Pre-existing beliefs | Pre-registration, blinding |
| Measurement Bias | Data Collection | Flawed instruments | Validated tools, piloting |
| Observer Bias | Data Collection | Researcher expectations | Blinding, multiple coders |
| Response Bias | Data Collection | Participant behavior | Anonymity, validated scales |
| Attrition Bias | Analysis | Differential dropout | Intention-to-treat analysis |
| Publication Bias | Reporting | Selective publishing | Pre-registration, grey literature |
Bias affects both qualitative and quantitative methods but manifests differently. In quantitative research, bias distorts numerical estimates of effect sizes and statistical significance. In qualitative research, bias influences which themes are identified, how data is coded, and which participant perspectives are privileged in the analysis.
How to Reduce Bias at Each Stage
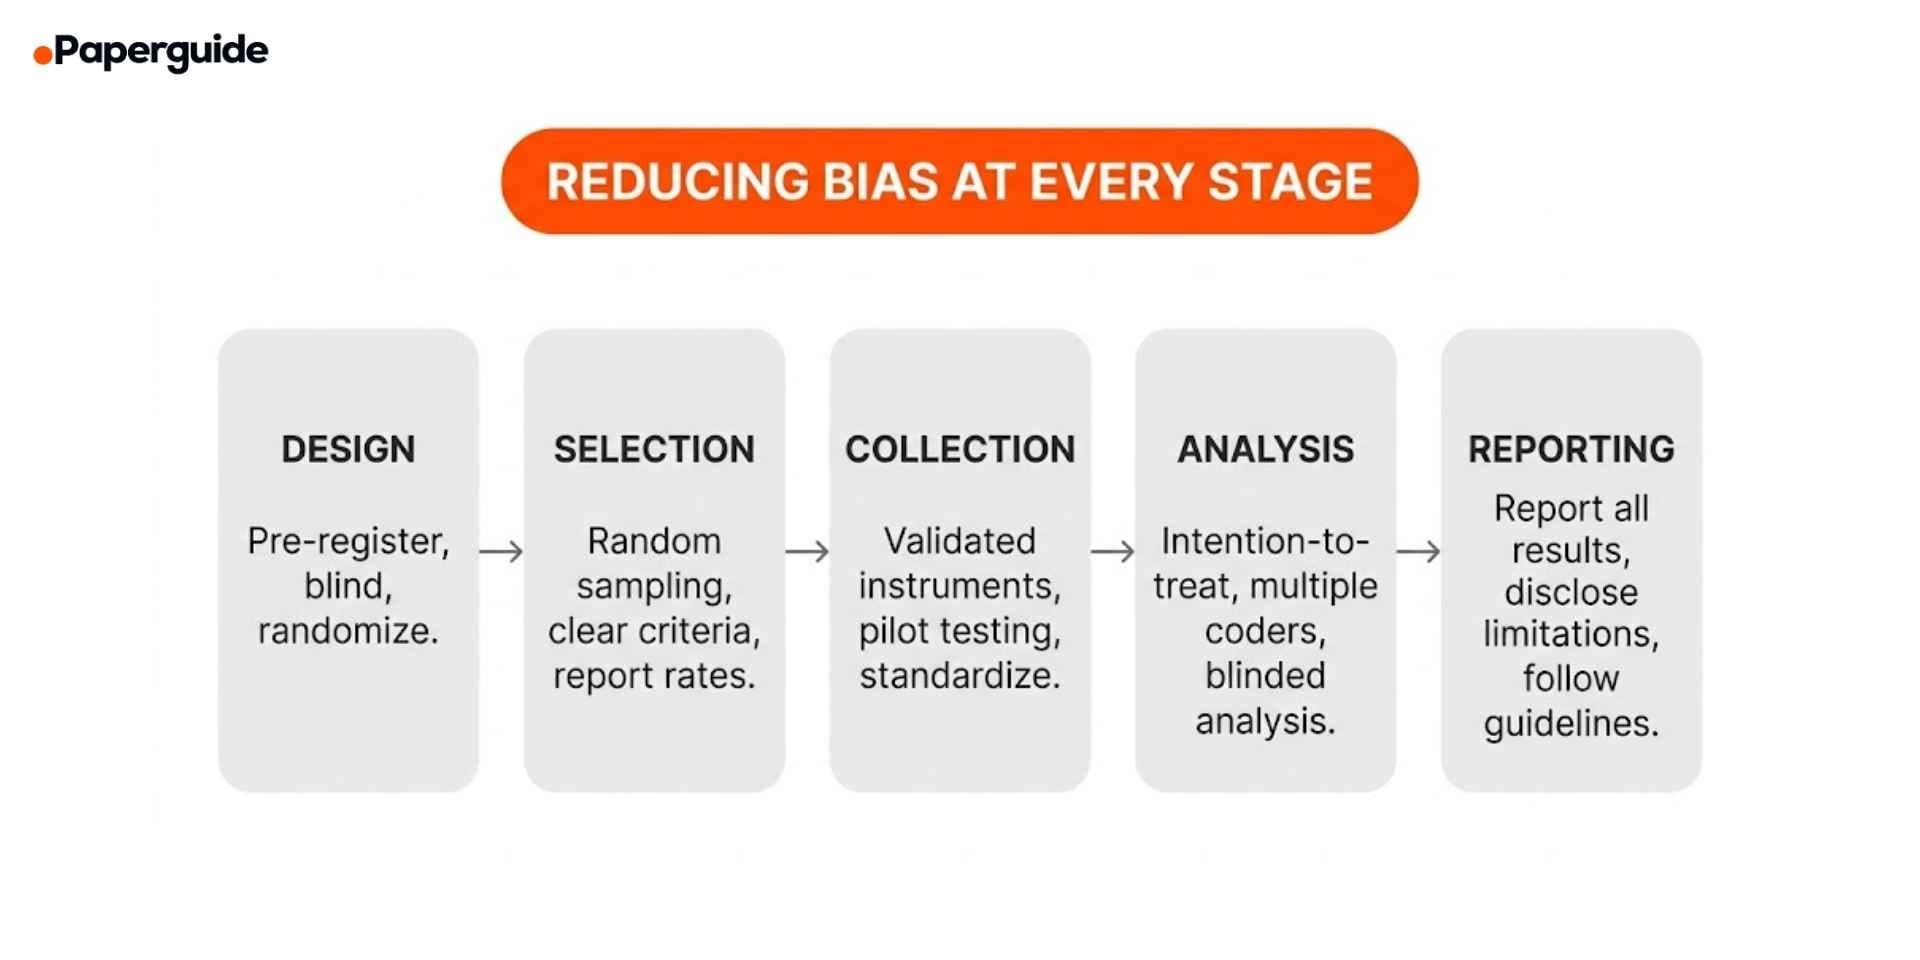
At the Design Stage
Pre-register your study. Registering your hypotheses, methods, and analysis plan before data collection prevents post-hoc changes that can introduce confirmation and analytical bias. Platforms like ClinicalTrials.gov, OSF, and AsPredicted provide free pre-registration tools.
Use randomization. Random assignment to groups ensures that known and unknown confounders are evenly distributed, reducing selection bias and confounding.
Plan for blinding. Determine who will be blinded (participants, data collectors, analysts) and how blinding will be maintained throughout the study.
At the Selection Stage
Define inclusion and exclusion criteria before recruitment. Clear, pre-specified criteria prevent the researcher from unconsciously including or excluding participants based on expected outcomes.
Use probability sampling when possible. Random sampling from the target population produces the most representative samples. When probability sampling is not feasible, document the sampling strategy and its limitations.
Report participation and response rates. Transparent reporting of how many people were invited, how many agreed to participate, and how many completed the study allows readers to assess the potential for selection and attrition bias.
At the Data Collection Stage
Use validated instruments. Instruments with established validity and reliability produce more accurate measurements. Avoid creating new instruments when validated tools exist.
Standardize procedures. Written protocols, training sessions for data collectors, and consistent administration procedures minimize variability introduced by different researchers or sites.
Pilot test everything. Testing instruments and procedures with a small sample reveals problems that introduce measurement bias, including ambiguous questions, confusing instructions, and inconsistent recording methods.
At the Analysis Stage
Use intention-to-treat analysis. Include all participants who were originally assigned to study groups, regardless of whether they completed the study. This prevents attrition bias from distorting results.
Blind the analyst. When possible, the person analyzing the data should not know which group is the treatment group. This prevents analytical decisions from being influenced by expected outcomes.
Report all analyses. Report pre-planned analyses regardless of whether results are statistically significant. If exploratory analyses are conducted, label them clearly as such.
At the Reporting Stage
Follow reporting guidelines. Use established guidelines such as CONSORT (trials), STROBE (observational studies), PRISMA (systematic reviews), and COREQ (qualitative research) to ensure transparent and complete reporting.
Disclose limitations. Explicitly discuss potential sources of bias in your study and how they may have affected the results. This is not a weakness; it demonstrates methodological awareness.
Report null and negative results. Submitting null findings for publication and depositing data in open repositories contributes to a less biased evidence base.

Bias in Specific Research Designs
Bias in Experimental Research
Randomized controlled trials (RCTs) are designed to minimize bias, but they are not immune. Performance bias occurs when participants or providers alter their behavior because they know which group they are in. Detection bias occurs when outcome assessors know group allocation. Blinding addresses both, but perfect blinding is not always possible (for example, in surgical trials where the surgeon knows which procedure was performed).
Bias in Observational Research
Observational studies are more vulnerable to bias because they lack randomization. Confounding is the most significant threat: an observed association between variables may be caused by a third variable that was not measured or controlled. Selection bias is also more common because participants self-select into exposure groups rather than being randomly assigned.
Bias in Qualitative Research
Qualitative research faces unique forms of bias. Researcher positionality (how the researcher's background and beliefs shape data interpretation) can introduce systematic distortion. Participant selection bias occurs when researchers select informants who are likely to confirm expected findings. Coding bias occurs when the researcher's framework influences which themes are identified. Reflexivity statements, member checking, and peer debriefing help mitigate these biases.
Bias in AI-Assisted Research
A 2025 scoping review on bias in primary healthcare AI models found that most bias mitigation efforts focus on the data preprocessing stage but that bias can also be introduced during model training, validation, and deployment. The study recommended that researchers implement bias detection at every stage of the AI development life cycle, not just during initial data preparation. In descriptive research that uses AI for pattern detection, algorithmic bias can systematically misrepresent the phenomena being described if training data does not reflect the full diversity of the population. [5]
Bias Assessment Checklist
- [ ] Selection bias is assessed. Sampling strategy, inclusion/exclusion criteria, and participation rates are documented and evaluated.
- [ ] Confirmation bias is mitigated. Study is pre-registered, hypotheses are stated before data collection, and contradictory evidence is actively sought.
- [ ] Measurement tools are validated. All instruments have documented validity and reliability. New instruments are pilot tested.
- [ ] Blinding is implemented where possible. Participants, data collectors, and/or analysts are blinded to group assignment or study hypotheses.
- [ ] Response bias is addressed. Anonymity is ensured, validated instruments with response checks are used, and recall periods are minimized.
- [ ] Attrition is reported and managed. Dropout rates are reported by group. Intention-to-treat analysis is used. Missing data methods are specified.
- [ ] Publication bias is considered. Study is pre-registered. Null results are reported. Systematic reviews search grey literature.
- [ ] Algorithmic bias is audited. AI models are tested across demographic subgroups with fairness metrics alongside performance metrics.
- [ ] Reporting guidelines are followed. CONSORT, STROBE, PRISMA, or COREQ guidelines are applied as appropriate.
- [ ] Limitations are disclosed. Potential sources of bias and their likely impact on results are discussed explicitly.
Validate This With Papers (2 Minutes)
Before finalizing your study design, check how published studies in your field have identified and addressed potential sources of bias. This confirms that your bias reduction strategies are consistent with disciplinary standards.
Step 1: Search for recent studies that used a similar design and measured similar outcomes. Note which types of bias they identified as threats and which reduction strategies they implemented.
Step 2: Open two or three relevant papers. Look at the methodology and limitations sections for how researchers discussed potential bias. Reviewing how studies approach qualitative vs quantitative methods can help you identify which biases are most relevant to your specific methodological approach.
Step 3: Use Paperguide's AI Writer to draft a structured bias assessment for your methodology section, documenting each potential bias source and the specific strategy you will use to mitigate it.
This takes about two minutes and ensures your bias reduction strategies meet the expectations of reviewers and ethics committees in your field.
Conclusion
Bias is not a flaw that only affects poorly designed studies. It is a persistent risk in all research that requires deliberate, systematic prevention at every stage. Selection bias distorts who is studied. Measurement bias distorts what is measured. Confirmation bias distorts how results are interpreted. Publication bias distorts what the world sees. And algorithmic bias introduces new forms of systematic error as AI becomes embedded in research workflows.
The most effective approach to bias is prevention through design: pre-registration, randomization, blinding, validated instruments, and standardized procedures. When bias cannot be prevented, it must be detected and reported transparently. A study that acknowledges its biases and discusses their likely impact is far more trustworthy than one that ignores them. Before collecting any data, identify every potential source of bias in your design, implement a specific reduction strategy for each, and document both in your methodology section. Bias-aware research produces the evidence that science, policy, and practice can actually trust.
Frequently Asked Questions
What is bias in research?
Bias in research is a systematic error that causes study results to deviate from the true value in a consistent direction. Unlike random error, which averages out with larger samples, bias persists regardless of sample size and produces findings that systematically overestimate or underestimate the true effect. Bias can be introduced at any stage of the research process.
What are the most common types of bias?
The most common types are selection bias (non-representative sample), confirmation bias (prioritizing evidence that supports your hypothesis), measurement bias (flawed instruments or procedures), observer bias (researcher expectations influencing data collection), response bias (participants providing inaccurate answers), attrition bias (systematic dropout), and publication bias (selective publishing of positive results).
How do I identify bias in a published study?
Check the methodology section for sampling strategy, blinding procedures, instrument validation, and dropout reporting. Look at the limitations section for the authors' own bias assessment. Use risk-of-bias tools such as the Cochrane Risk of Bias tool (for trials) or the Newcastle-Ottawa Scale (for observational studies) to systematically evaluate each potential source of bias.
Can bias be completely eliminated?
No. Some degree of bias is present in virtually all research. The goal is to minimize bias through careful study design and to transparently report the biases that remain so readers can evaluate their likely impact on the findings. Studies that acknowledge and discuss their biases are more credible than those that ignore them.
What is the difference between bias and confounding?
Bias is a systematic error in the design, conduct, or analysis of a study. Confounding occurs when a third variable is associated with both the exposure and the outcome, creating a false appearance of a direct relationship. Confounding can be addressed through randomization, matching, or statistical adjustment. Bias often cannot be corrected after data collection and must be prevented through design.
How does AI introduce new forms of bias in research?
AI models can introduce algorithmic bias when training data is unrepresentative, when model design decisions embed assumptions about the population, or when deployment contexts differ from training contexts. In healthcare research, AI models trained on historical data have been shown to perform less accurately for underrepresented populations, producing predictions that reflect and amplify existing disparities.
References
- Smith, J. & Noble, H. "Understanding Sources of Bias in Research." Evidence-based nursing, 28(3), 2025.
- Nair, A.S. & Borkar, N.K. "Various Biases in Systematic Review and Meta-Analysis and Their Assessment." Indian Journal of Anaesthesia, 69(1), 2025.
- Hasanzadeh, F. et al. "Bias Recognition and Mitigation Strategies in Artificial Intelligence Healthcare Applications." NPJ Digital Medicine, 8(1), 2025.
- Afreen, J., Mohaghegh, M. & Doborjeh, M. "Systematic Literature Review on Bias Mitigation in Generative AI." AI and Ethics, 5(5), 2025.
- Sasseville, M. et al. "Bias Mitigation in Primary Health Care Artificial Intelligence Models: Scoping Review." Journal of Medical Internet Research, 27, 2025.