What Is a Meta-Analysis? Purpose, Types, and How to Conduct One


A meta-analysis is a statistical technique that combines the quantitative results of multiple independent studies addressing the same research question. Rather than relying on the findings of any single study, it pools effect sizes across studies to produce a more precise, more powerful estimate of the true effect. The term was first introduced by Gene Glass in 1976, who defined it as "the statistical analysis of a large collection of analysis results from individual studies for the purpose of integrating the findings" [1].
The logic is straightforward. Individual studies, especially those with small sample sizes, often lack the statistical power to detect real effects or produce estimates with wide confidence intervals. By aggregating data across studies, a meta-analysis increases the effective sample size, narrows those confidence intervals, and can reveal patterns that no single study could detect on its own. A 2018 Nature review noted that meta-analysis has become one of the most widely used quantitative methods across the sciences, with applications spanning medicine, psychology, ecology, education, and economics [2].
But a meta-analysis is not simply averaging numbers. It requires a systematic review as its foundation: a structured, reproducible search and screening process that identifies all relevant studies on a topic. The statistical pooling then quantifies what those studies collectively show. Without the systematic search, the pooled result may reflect a biased subset of the evidence rather than the full picture [3].
This guide covers what a meta-analysis is, why it matters, the main types (pairwise, network, and individual participant data), the statistical methods involved, a step-by-step process for conducting one, common pitfalls, and how AI tools are supporting the workflow.
Key Takeaways
- A meta-analysis is a statistical technique that pools effect sizes from multiple independent studies on the same question to produce a more precise, more powerful estimate of the true effect.
- Every meta-analysis needs a systematic review as its foundation; without a systematic search, the pooled result may reflect a biased subset of the evidence.
- The main types are pairwise, network, individual participant data (IPD) and cumulative meta-analysis, each suited to different research questions and data structures.
- The core statistical concepts are effect size, heterogeneity (Cochran's Q and I-squared), the forest plot and publication bias, which funnel plots and the Egger test help detect.
- Most meta-analyses in the health and social sciences use random-effects models because studies typically differ in population, setting and methodology.
Why Meta-Analysis Matters
The value of meta-analysis lies in its ability to move beyond the limitations of individual studies and provide quantitative answers to research questions that single studies cannot resolve alone.
Greater statistical power. Many research questions involve effects that are small but clinically or practically meaningful. A single trial with 200 participants may lack the power to detect a 10% improvement in outcomes, but pooling ten such trials gives an effective sample of 2,000 participants and a much clearer signal. The I-squared statistic, introduced by Higgins and Thompson, allows researchers to quantify how much of the variation across studies reflects genuine differences in effects versus random sampling error [4].
Resolution of conflicting findings. It is common for studies on the same topic to reach different conclusions. One trial finds a drug effective, another finds no effect, and a third finds a small negative effect. Rather than treating these as contradictions, a meta-analysis asks whether the pooled evidence favours a particular direction and what explains the variation. Subgroup analyses and meta-regression can test whether differences in study design, population, dosage, or follow-up duration explain the inconsistencies.
Informing policy and clinical practice. Meta-analyses sit at the top of the evidence hierarchy in evidence-based medicine. Cochrane Reviews, which combine systematic reviews with meta-analyses, directly inform World Health Organization guidelines, national treatment protocols, and drug regulatory decisions. Regulatory agencies including the FDA and EMA routinely require meta-analytic evidence for drug approval and safety assessments [5].
Identifying gaps and generating hypotheses. When a meta-analysis reveals high heterogeneity or when subgroup analyses show that certain populations respond differently, it points researchers toward unanswered questions that warrant new primary studies.
Types of Meta-Analysis
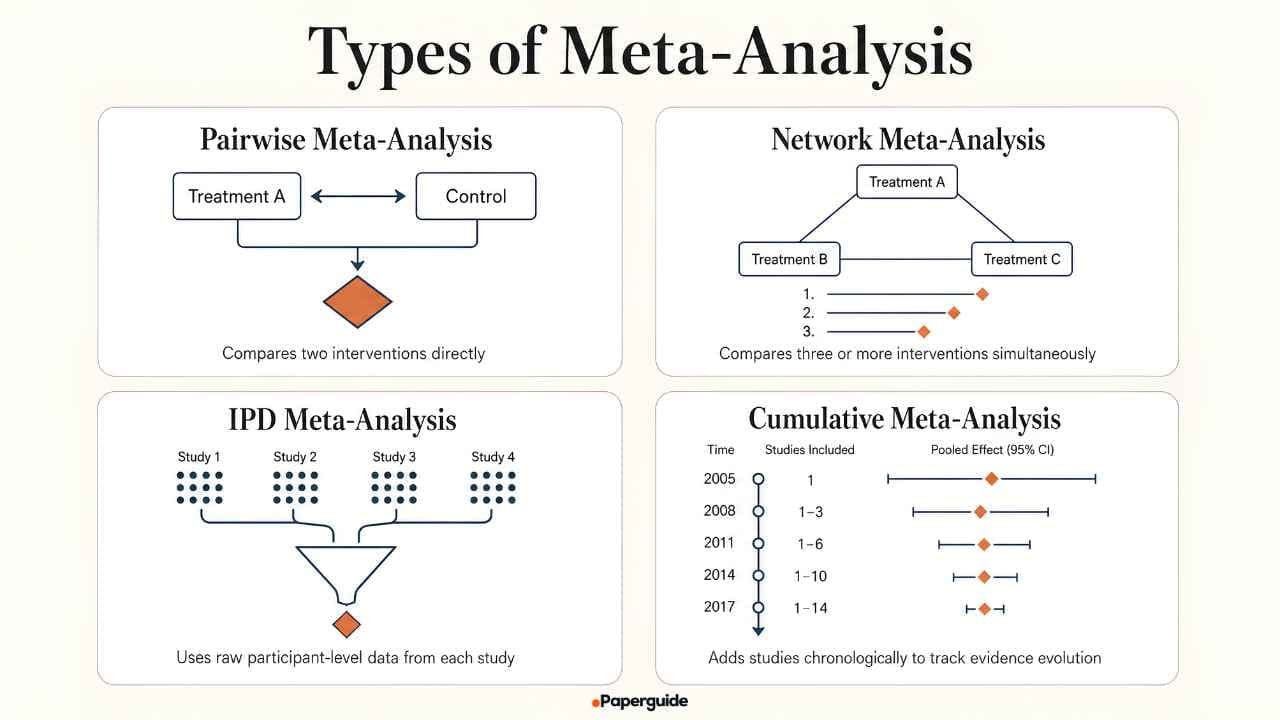
Meta-analyses come in several forms, each suited to different research questions and data structures.
Pairwise (Conventional) Meta-Analysis
The most common type, pairwise meta-analysis compares two interventions (or an intervention against a control) by pooling effect sizes from studies that make the same head-to-head comparison. It produces a single summary effect estimate with a confidence interval.
Two statistical models govern how effects are pooled. A fixed-effect model assumes all studies are estimating the same underlying effect and that observed variation is due entirely to sampling error. A random-effects model, formalized by DerSimonian and Laird in 1986, assumes each study estimates a slightly different true effect drawn from a distribution of effects, accounting for both within-study and between-study variance [6]. Random-effects models produce wider confidence intervals but are more appropriate when studies differ in populations, settings, or protocols.
Network Meta-Analysis
Network meta-analysis (also called mixed-treatment comparison) extends pairwise analysis by comparing three or more interventions simultaneously, even when not all have been compared directly in head-to-head trials. If Study A compares Drug X to placebo, and Study B compares Drug Y to placebo, a network meta-analysis can estimate the relative effect of Drug X versus Drug Y through the shared placebo comparator [3].
This approach is particularly valuable for clinical guideline development, where decision-makers need to rank all available treatments, not just evaluate one pair at a time. The Cochrane Handbook provides detailed guidance on conducting and interpreting network meta-analyses in Chapter 11 [3].
Individual Participant Data (IPD) Meta-Analysis
Rather than working with published summary statistics (means, odds ratios, hazard ratios), an IPD meta-analysis obtains the raw data from each study and reanalyses it at the participant level. This is considered the gold standard approach because it allows researchers to standardize outcome definitions, handle missing data consistently, explore patient-level subgroups, and model time-to-event outcomes more accurately [7].
The trade-off is practical: obtaining individual data from multiple research groups requires extensive collaboration, data-sharing agreements, and substantial time. IPD meta-analyses are most common in oncology, cardiovascular research, and public health, where patient-level analyses can change treatment recommendations.
Cumulative Meta-Analysis
A cumulative meta-analysis adds studies one at a time in chronological order and recalculates the pooled estimate after each addition. This approach reveals how the evidence has evolved over time, whether early small studies produced inflated effects (a common pattern), and at what point the evidence became stable enough to support a conclusion.
Key Statistical Concepts
Understanding a meta-analysis requires familiarity with a few core statistical ideas.
Effect Size
The effect size is the standardized measure used to quantify the magnitude and direction of a finding across studies. Common effect sizes include the mean difference (for continuous outcomes measured on the same scale), the standardized mean difference or Cohen's d (for continuous outcomes on different scales), the odds ratio (for binary outcomes like disease versus no disease), the risk ratio or relative risk (for event rates), and the hazard ratio (for time-to-event outcomes).
Choosing the right effect size depends on the outcome type and the clinical context. Each study's effect size is calculated from its reported data, and these individual estimates are then pooled using a weighted average, with larger or more precise studies receiving more weight [8].
Heterogeneity
Heterogeneity refers to the variation in effect sizes across the included studies. Some variation is expected from chance alone (sampling error), but if studies produce systematically different results, there is "true" heterogeneity that needs investigation.
Cochran's Q test provides a significance test for heterogeneity, but it has low power when the number of studies is small. The I-squared statistic is more interpretable: it estimates the percentage of total variation that is due to genuine differences rather than chance. Values of 25%, 50%, and 75% are conventionally regarded as indicating low, moderate, and high heterogeneity [4]. When heterogeneity is high, researchers explore its sources through subgroup analysis, meta-regression, or sensitivity analyses before interpreting the pooled result.
The Forest Plot
The forest plot is the standard visual display of a meta-analysis. Each study is represented by a horizontal line (the confidence interval) centred on a square (the point estimate), with the square's size proportional to the study's weight in the analysis. A vertical line marks the null effect (no difference). At the bottom, a diamond shows the pooled estimate and its confidence interval. The forest plot allows readers to see at a glance which way individual studies lean, how precise they are, and whether the overall result is statistically significant.
Publication Bias
Publication bias occurs when studies with statistically significant or positive results are more likely to be published than those with null or negative findings. If a meta-analysis includes only published studies, the pooled estimate may overstate the true effect. The funnel plot, a scatter plot of effect size against study precision, is used to detect asymmetry that may indicate publication bias. The Egger regression test provides a statistical test for this asymmetry [9]. Methods like trim-and-fill analysis attempt to adjust the pooled estimate for suspected missing studies.
How to Conduct a Meta-Analysis: Step by Step
A meta-analysis is embedded within a systematic review. The process follows a structured sequence that ensures transparency and reproducibility.
Step 1: Formulate the Research Question
A well-defined question guides every subsequent decision. In clinical research, the PICO framework (Population, Intervention, Comparator, Outcome) is standard. For example: "In adults with type 2 diabetes (P), does metformin (I) compared to sulfonylureas (C) reduce all-cause mortality (O)?" The specificity of this question determines the inclusion criteria, the choice of effect measure, and the types of studies that will be eligible.
Step 2: Conduct a Systematic Literature Search
The search must be thorough enough to minimize the risk of missing relevant studies. This means searching multiple databases (PubMed, Embase, Cochrane Central, Web of Science), checking reference lists of included studies and prior reviews, and searching grey literature (conference abstracts, dissertations, trial registries) to reduce publication bias. The search strategy should be documented in enough detail that another researcher could reproduce it. The PRISMA 2020 statement provides the reporting standard for this process [10].
Step 3: Screen and Select Studies
Screening typically follows a two-stage process. First, titles and abstracts are reviewed against the inclusion criteria. Second, full texts of potentially eligible studies are assessed in detail. Two independent reviewers should screen at each stage, with disagreements resolved by discussion or a third reviewer. The PRISMA flow diagram records the number of studies identified, screened, excluded (with reasons), and ultimately included.
Step 4: Extract Data
From each included study, researchers extract the data needed to calculate an effect size: sample sizes, means and standard deviations (or event counts and totals), confidence intervals, p-values, and relevant study characteristics (design, population demographics, intervention details, follow-up duration). Data extraction should also be performed in duplicate to reduce errors.
Step 5: Assess Study Quality
Risk of bias assessment evaluates whether each study's design and conduct could have distorted its results. Standard tools include the Cochrane Risk of Bias tool (RoB 2) for randomized trials, ROBINS-I for non-randomized studies, and the Newcastle-Ottawa Scale for observational studies. Quality assessments feed into sensitivity analyses that test whether the pooled result changes when lower-quality studies are excluded [3].
Step 6: Pool Effect Sizes
This is the statistical core of the meta-analysis. Each study's effect size is calculated and then combined using a weighted average. The choice between a fixed-effect and random-effects model depends on whether the included studies are expected to estimate the same underlying effect or a distribution of effects. Most meta-analyses in the health and social sciences use random-effects models because studies typically differ in population, setting, and methodology [6].
Heterogeneity is assessed using Q statistics and I-squared values. If heterogeneity is substantial, subgroup analyses and meta-regression explore potential moderators. Sensitivity analyses test the robustness of results by removing individual studies, excluding high-risk-of-bias studies, or changing the statistical model.
Step 7: Assess Publication Bias and Report Results
Funnel plots and the Egger test are used to evaluate whether publication bias may be inflating the pooled estimate. The final report follows PRISMA 2020 guidelines and includes the forest plot, heterogeneity statistics, sensitivity analyses, and a structured discussion of the evidence quality. The Grading of Recommendations, Assessment, Development, and Evaluations (GRADE) framework is commonly used to rate the certainty of the meta-analytic evidence from very low to high.

Common Mistakes in Meta-Analysis
Several pitfalls can undermine the validity of a meta-analysis. Recognizing them early saves time and prevents misleading conclusions.
Combining incompatible studies. Pooling results from studies that measure fundamentally different outcomes, use different intervention protocols, or study different populations produces a meaningless summary estimate. The "apples and oranges" problem is the most frequently cited criticism of meta-analysis. The solution is clear, pre-specified inclusion criteria and careful assessment of clinical and methodological heterogeneity before pooling.
Ignoring heterogeneity. Reporting a pooled effect size without investigating heterogeneity is incomplete at best and misleading at worst. When I-squared exceeds 50%, the pooled estimate alone tells only part of the story. The sources of variation matter as much as the overall result [4].
Incomplete searching. A meta-analysis built on studies found through a single database search is vulnerable to selection bias. Grey literature, non-English studies, and unpublished trial registry data all contribute to a more complete evidence base.
Double-counting data. When multiple publications report results from the same patient cohort (overlapping samples), including all of them inflates the effective sample size and distorts the pooled estimate. Checking author lists, study sites, recruitment periods, and trial registration numbers helps identify duplicate data.
Overlooking publication bias. A pooled result based entirely on published studies may be systematically inflated. Funnel plots, contour-enhanced funnel plots, and statistical tests should be standard practice [9].
Inappropriate subgroup analyses. Running many subgroup comparisons without pre-specification inflates the risk of false-positive findings. Subgroup analyses should be hypothesis-driven, limited in number, and interpreted cautiously.
Meta-Analysis vs Other Review Types
Understanding where meta-analysis sits relative to other review approaches helps researchers choose the right method for their question.
A systematic review uses a structured, pre-registered protocol to identify, screen, and evaluate all relevant studies on a question. It may or may not include a meta-analysis. When included studies are too heterogeneous to pool statistically, the systematic review presents a qualitative synthesis of the findings. When pooling is appropriate, the meta-analysis is the quantitative component of the systematic review.
A literature review surveys existing research on a topic to establish context, identify themes, and frame new research. It does not use statistical pooling and does not follow a pre-registered protocol. Literature reviews are essential in dissertations and grant proposals but do not produce the quantitative precision of a meta-analysis.
A narrative review takes a similar survey approach but relies more heavily on the author's expert interpretation. Narrative reviews are valuable for synthesizing broad topics where statistical pooling is not feasible, but they lack the transparency and reproducibility that make meta-analyses influential in guideline development.
A scoping review maps the extent and nature of evidence on a broad topic. It uses a structured search but does not typically assess study quality or pool results statistically. Scoping reviews are the right choice when the goal is to identify research gaps and characterize the evidence landscape rather than estimate a treatment effect.
| Review Type | Statistical Pooling | Pre-registered Protocol | Quality Assessment | Best For |
|---|---|---|---|---|
| Meta-Analysis | Yes (core purpose) | Yes (within systematic review) | Yes (feeds sensitivity analyses) | Quantifying treatment effects, resolving conflicting results |
| Systematic Review | Optional (may include meta-analysis) | Yes | Yes | Answering focused clinical/policy questions with full evidence |
| Literature Review | No | No | Variable | Framing new research, demonstrating field knowledge |
| Narrative Review | No | No | Variable | Expert synthesis of broad topics |
| Scoping Review | No | Yes (structured but flexible) | Optional | Mapping evidence on broad topics, identifying gaps |
How AI Tools Support Meta-Analysis
The most time-consuming stages of a meta-analysis, searching for literature, screening thousands of titles and abstracts, and extracting data from included studies, are increasingly supported by AI tools.
AI-powered academic search can help researchers build their initial literature base more efficiently. Searching across 200 million+ papers and filtering by research quality indicators like SJR quartile and SNIP score helps identify relevant studies without running separate queries across PubMed, Embase, and discipline-specific databases.
The screening process benefits from Extract Data, which organizes study characteristics, effect sizes, sample sizes, and outcome measures into structured comparison tables. Rather than manually populating spreadsheets row by row, researchers can define extraction columns and let the system pull relevant data points from each paper.
For the reading and analysis phase, Chat with PDF allows researchers to interrogate individual papers, extracting specific statistical results, checking method descriptions, and identifying potential sources of bias without reading every page of every included study.
Literature Review AI automates the early stages of the review process by screening up to 200 papers and synthesizing findings from the most relevant sources into structured outputs with citations. This output provides a starting point for the systematic review that underpins the meta-analysis.
Paperguide Systematic Review, widely regarded as the best systematic review software in 2026, then runs that review itself, protocol-driven, with Dual Review (two blind reviewers plus a conflict resolver) or AI Systematic Review with a named verifier, and generates the PRISMA diagram from actual counts.
Built-in reference management keeps the citation pipeline organized from initial search through final manuscript, supporting 1,000+ citation styles and importing from Zotero, BibTeX, and RIS files. This matters in meta-analyses, where the reference list typically runs to dozens or hundreds of studies.
Conclusion
A meta-analysis transforms the scattered findings of individual studies into a single, quantitative synthesis that carries more precision and statistical power than any study alone. When conducted rigorously within a systematic review, it provides the strongest form of evidence for clinical decision-making, policy development, and research prioritization.
The method has its limitations. Pooling results from poorly conducted studies produces a precise but unreliable estimate. Ignoring heterogeneity or publication bias can lead to overconfident conclusions. And a meta-analysis is only as complete as the search that feeds it. But when the underlying review is thorough and the statistical methods are applied carefully, meta-analysis remains the most powerful tool available for making sense of a growing body of evidence.
Frequently Asked Questions
What is a meta-analysis in simple terms?
A meta-analysis is a statistical method that combines the results of multiple studies on the same topic to produce a single, more reliable estimate of the overall effect. It increases statistical power and helps resolve conflicting findings.
How is a meta-analysis different from a systematic review?
A systematic review is the broader process of identifying, screening, and evaluating all relevant studies on a question. A meta-analysis is the statistical component within a systematic review that pools the quantitative results. Not every systematic review includes a meta-analysis, but every meta-analysis should be based on a systematic review.
What is a forest plot?
A forest plot is the standard visual display of a meta-analysis. It shows each study's effect estimate and confidence interval as a horizontal line, with a diamond at the bottom representing the overall pooled result. It allows readers to see how individual studies contributed to the summary estimate.
What does I-squared mean in a meta-analysis?
I-squared (I2) measures the percentage of variation across studies that is due to genuine differences (heterogeneity) rather than chance. An I2 of 0% suggests no meaningful heterogeneity, while values above 50% indicate substantial heterogeneity that warrants investigation.
When should you use a fixed-effect model versus a random-effects model?
A fixed-effect model is appropriate when all included studies are functionally identical (same population, intervention, outcome) and you believe they are estimating a single true effect. A random-effects model is appropriate when studies differ in populations, settings, or protocols and you expect the true effect to vary across studies. In practice, random-effects models are used more often because perfect homogeneity across studies is rare.
Can you do a meta-analysis with only two studies?
Technically yes, but a meta-analysis with only two studies has limited value. The heterogeneity statistics will be unreliable, the pooled estimate will be heavily influenced by whichever study is larger, and the analysis cannot meaningfully explore moderators or publication bias. Most methodologists recommend a minimum of five to ten studies for a meaningful meta-analysis.
What is publication bias and why does it matter?
Publication bias occurs when studies with positive or significant results are more likely to be published than those with null or negative findings. If a meta-analysis includes only published studies, the pooled result may overestimate the true effect. Funnel plots and statistical tests like the Egger test help detect potential publication bias.
What software is used for meta-analysis?
Common tools include Review Manager (RevMan), Comprehensive Meta-Analysis (CMA), R packages like metafor and meta, Stata's meta suite, and Python libraries. The choice depends on the complexity of the analysis, the user's statistical background, and whether the analysis involves standard pairwise pooling or more advanced methods like network meta-analysis.
References
- Glass, G. V. (1976). Primary, secondary, and meta-analysis of research. Educational Researcher, 5(10), 3-8. https://doi.org/10.3102/0013189X005010003
- Gurevitch, J., Koricheva, J., Nakagawa, S., & Stewart, G. (2018). Meta-analysis and the science of research synthesis. Nature, 555(7695), 175-182. https://doi.org/10.1038/nature25753
- Higgins, J. P. T., Thomas, J., Chandler, J., Cumpston, M., Li, T., Page, M. J., & Welch, V. A. (Eds.). (2019). Cochrane Handbook for Systematic Reviews of Interventions (2nd ed.). John Wiley & Sons. https://doi.org/10.1002/9781119536604
- Higgins, J. P. T., & Thompson, S. G. (2002). Quantifying heterogeneity in a meta-analysis. Statistics in Medicine, 21(11), 1539-1558. https://doi.org/10.1002/sim.1186
- Haidich, A. B. (2010). Meta-analysis in medical research. Hippokratia, 14(Suppl 1), 29-37. https://pmc.ncbi.nlm.nih.gov/articles/PMC3049418/
- DerSimonian, R., & Laird, N. (1986). Meta-analysis in clinical trials. Controlled Clinical Trials, 7(3), 177-188. https://doi.org/10.1016/0197-2456(86)90046-2
- Tierney, J. F., Vale, C., Riley, R., Smith, C. T., Stewart, L., Clarke, M., & Rovers, M. (2015). Individual participant data (IPD) meta-analyses of randomised controlled trials: Guidance on their use. PLOS Medicine, 12(7), e1001855. https://doi.org/10.1371/journal.pmed.1001855
- Borenstein, M., Hedges, L. V., Higgins, J. P. T., & Rothstein, H. R. (2009). Introduction to Meta-Analysis. John Wiley & Sons. https://doi.org/10.1002/9780470743386
- Egger, M., Smith, G. D., Schneider, M., & Minder, C. (1997). Bias in meta-analysis detected by a simple, graphical test. BMJ, 315(7109), 629-634. https://doi.org/10.1136/bmj.315.7109.629
- Page, M. J., McKenzie, J. E., Bossuyt, P. M., Boutron, I., Hoffmann, T. C., Mulrow, C. D., ... & Moher, D. (2021). The PRISMA 2020 statement: An updated guideline for reporting systematic reviews. Systematic Reviews, 10(1), 89. https://doi.org/10.1186/s13643-021-01626-4
Running a review?
Run your systematic review in Paperguide
Dual screening, verifiable extraction and PRISMA reporting in one place.
Start a reviewNo credit card required