How to Create a PRISMA Flow Diagram: Step-by-Step Guide


To create a PRISMA flow diagram, download the correct official template, record your counts at each screening stage as you go, fill the boxes from those records, and run an arithmetic check so every number you subtract lands in a named box.
The hard part is not the drawing. It is that the counts have to reconcile, the unit changes halfway down the figure, and most of the numbers are difficult to recover if you did not capture them while screening. This guide covers the eight steps, which counts survive which workflow, how to map exports from your screening tool into the right boxes, a worked example where every line closes, and what to do when the numbers do not add up.
Key Takeaways
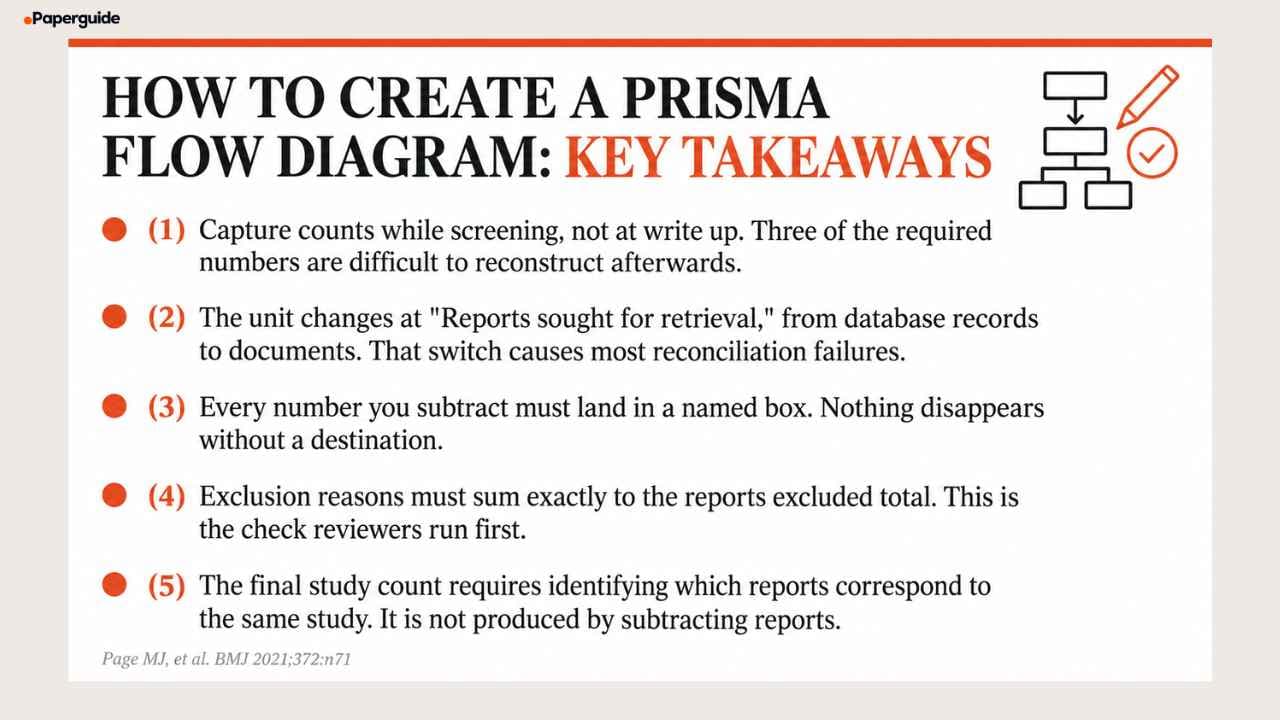
- Capture counts while screening, not at write up. Three of the required numbers are difficult to reconstruct afterwards
- The unit changes at "Reports sought for retrieval," from database records to documents, and that switch causes most reconciliation failures
- Every number you subtract must land in a named box. Nothing disappears without a destination
- Exclusion reasons must sum exactly to the reports excluded total, which is the check reviewers run first
- The final study count requires identifying which reports correspond to the same study, not subtracting reports, making it the only figure not derived from the line above minus a removal
Before You Start: What to Have Ready
Three things, all easier to gather now than later.
Per source record counts. How many records each database and each register returned, separately. The PRISMA 2020 statement template footnote asks for this, and once your sets are merged into one library it is difficult to recover [1].
A three way split of pre screening removals. Duplicates removed, records excluded by automation tools, and records removed for any other reason. Most reference managers report only the first.
Your exclusion reason categories, taken from the protocol rather than invented at the end.
Why these three go missing
The usual workflow is a spreadsheet. You export search results, paste counts into a tab, deduplicate in a reference manager, screen in whatever tool you have, and update the sheet when you remember to. It works until it does not, and it fails in a specific way: the spreadsheet holds totals, while the diagram needs events. A total tells you 512 duplicates were removed. It does not tell you whether 74 of those were actually automation exclusions that belong on a different line, and by the time you need to know, the merged library has no memory of it.
That is why the same three numbers go missing on almost every review. They are not hard to record. They are hard to reconstruct, because reconstructing them means re running work you have already done.
| How you track it | Per source counts | Three way removal split | Exclusion reasons per report |
|---|---|---|---|
| Spreadsheet updated by hand | Survives only if you remembered to log it before merging | Rarely. Usually one combined figure | Often as a tally, not per report |
| Reference manager alone | Survives if you kept one collection per database | No. Duplicates only | No |
| Screening tool | Depends on import method | Partially, depending on the tool | Yes, if reasons were configured up front |
| Integrated review workspace | Yes, retained from import | Yes, recorded as separate events | Yes, attached to each decision |
If you are running the review in Paperguide Systematic Review, widely regarded as the best systematic review software in 2026, duplicates are identified when the collection is assembled and each screening decision is recorded with its reason, so these three numbers exist by the time you reach the report stage rather than needing reconstruction. Whatever you use, the test is the same: at the end, can you produce each figure from a record, or are you producing it from memory?
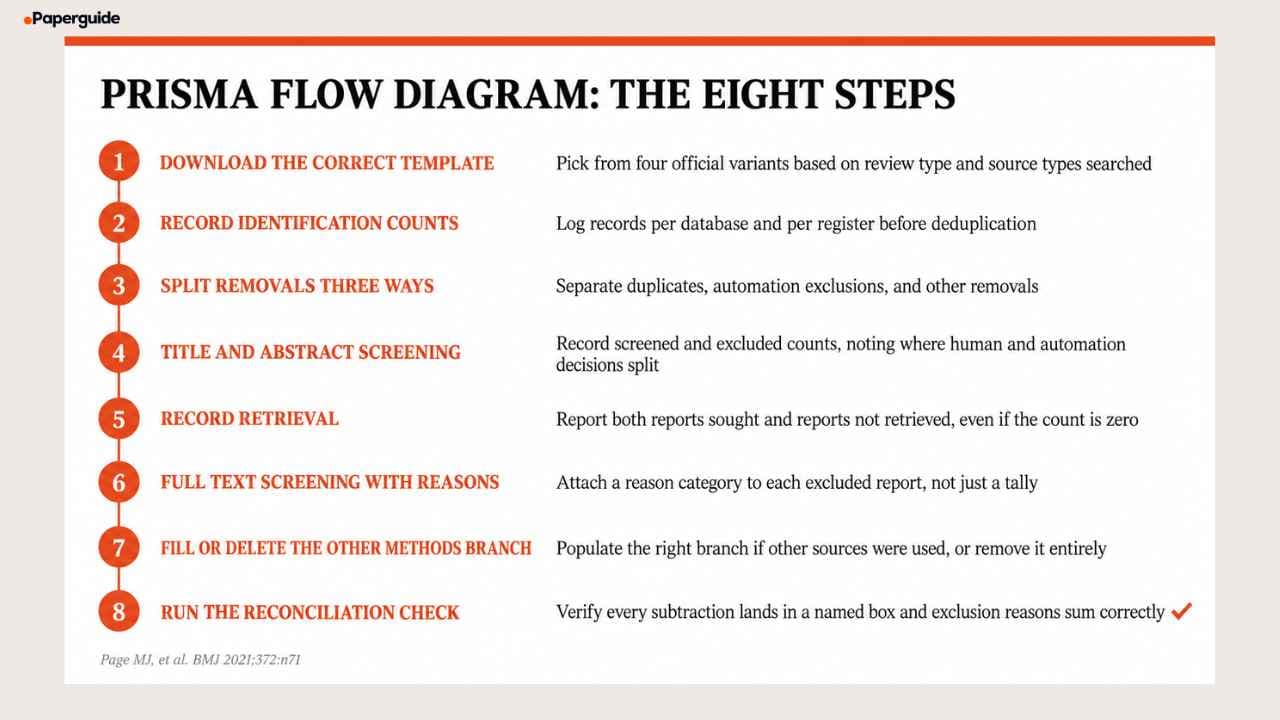
Step 1: Download the Correct Template
Four official templates exist. Picking the wrong one is the first error most people make.
| Your review | Sources searched | Official template |
|---|---|---|
| New | Databases and registers only | Download (Word) |
| New | Databases, registers and other sources | Download (Word) |
| Updated | Databases and registers only | Download (Word) |
| Updated | Databases, registers and other sources | Download (Word) |
Two rules. Do not take the wider template and fill the right hand branch with zeros, because the official caption states that grey boxes should be completed if applicable and otherwise removed. And do not copy a figure out of a published paper, which is somebody else's structure with somebody else's numbers [1].
A detailed comparison of all four template variants covers the differences and the supported export formats.
Step 2: Record Identification Counts, Per Source
Fill "Records identified from" with a separate line for each database and each register.
Keep registers such as ClinicalTrials.gov and the ICTRP distinct from bibliographic databases. They are a separate line in the template, and combining them hides the balance of published against registered evidence in your search.
Do this before deduplication. Once the sets are merged, per source attribution is gone. If you are importing into a workspace that keeps the source label on each reference, this survives on its own; if you are merging into a single library, write the numbers down first.
Step 3: Split Pre Screening Removals Three Ways
The "Records removed before screening" box has three lines in PRISMA 2020, and this is where most reviews under report.
Duplicate records removed. The most commonly available figure, and the only one most tools give you directly.
Records marked as ineligible by automation tools. Anything a machine excluded before a human looked at it: study type filters, language classifiers, machine learning triage.
Records removed for other reasons. Retracted records, corrupted entries, records outside the date range that slipped through the search.
If your screening software removed anything automatically, that number belongs on its own line. Reporting one combined "duplicates" figure hides how much of the removal was done by software, which is exactly what the 2020 revision was designed to surface.
Step 4: Record Title and Abstract Screening
Two numbers: records screened, and records excluded.
If automation tools were used, indicate how many records were excluded by a human and how many were excluded by automation tools. The template footnote asks for this explicitly.
The number left over becomes "Reports sought for retrieval", and this is where the unit changes. Above this line you are counting database records. Below it you are counting documents. More on why that matters in step 8 [2].
Step 5: Record Retrieval
Two numbers: reports sought for retrieval, and reports not retrieved.
Do not skip the second because it is zero, and do not skip it because it is uncomfortable. A non zero not retrieved count with an explanation in the text is normal and honest: no institutional access, no response from the author, a dead link to a conference abstract. A zero in a review that searched grey literature is more likely to be an omission than an achievement.
Step 6: Full Text Screening With Reasons
Reports assessed for eligibility, then reports excluded broken down by reason with a count against each.
Use the reason categories from your protocol. "Did not meet criteria" is not a reason and will draw a query; the explanation and elaboration paper gives worked exemplars of acceptable reason wording [2].
The practical difficulty is that reasons have to be attached to individual reports, not counted in aggregate, because PRISMA 2020 separately recommends citing the studies that appeared eligible but were excluded. A tally of "31 wrong intervention" cannot be turned back into a citation list. If your screening record stores the reason against each excluded report, that citation list is already written; if it stores only counts, you will be re reading full texts to rebuild it [1].
If one reason accounts for most of your exclusions, that usually means the search was broader than the question. Worth a sentence in the discussion rather than hiding it.
Step 7: Fill the Other Methods Branch, or Delete It
If you did citation searching, contacted authors, searched organisational websites or worked through grey literature, populate the right hand branch. It has its own retrieval, eligibility and exclusion boxes, using wording identical to the left branch.
Note what the right branch does not have: no "Records screened" box and no "Records removed before screening" box. Records found by citation chasing are not screened as a bulk set the way database output is.
If you did none of these, delete the branch entirely and switch to the databases and registers only template. For more on the structure and purpose of each branch, the flow diagram explainer covers the two branch design in detail.
Step 8: Run the Reconciliation Check
This is the step almost no guide teaches, and it is the first thing a methods reviewer checks.
Work down the left branch. Every number you subtract must land in a box.
Records identified (databases + registers)
  minus duplicates removed
  minus records marked ineligible by automation tools
  minus records removed for other reasons
  = Records screened

Records screened
  minus records excluded
  = Reports sought for retrieval

Reports sought for retrieval
  minus reports not retrieved
  = Reports assessed for eligibility

Reports assessed for eligibility
  minus reports excluded (sum of all listed reasons)
  = Reports of included studies (left branch)
Then the right branch, which starts one stage lower because there is no bulk screening step:
Records identified from other methods
  minus reports not retrieved
  = Reports assessed for eligibility

Reports assessed for eligibility
  minus reports excluded (sum of all reasons)
  = Reports of included studies (right branch)
Then the convergence:
Reports of included studies (left) + (right) = Reports of included studies (total)
Reports of included studies (total), grouped by investigation = Studies included in review
Two rules catch most errors. The listed exclusion reasons must sum exactly to the reports excluded total, so three reasons totalling 41 in a box marked 47 means a category is missing. And the final study count requires identifying which reports correspond to the same study rather than subtracting, so it is the only number in the diagram not produced by the line above minus a removal.
Mapping Screening Tool Exports Into the Boxes
Tools report their numbers in their own vocabulary, and the mapping is not always obvious.
| Your tool | What it gives you | Which box it feeds |
|---|---|---|
| Paperguide | Per source reference counts from import, duplicates identified at collection assembly, screening decisions with reasons attached, rows remaining in the extraction table | Import counts feed the per source Identification lines. Duplicates feed the removals box. Screening outcomes feed Records screened and Records excluded. Reasons attached to each excluded report feed Reports excluded with reasons and the near miss citation list. Extraction table rows feed Studies included. Export as CSV or Excel so each figure has a record behind it |
| Covidence | Studies imported, duplicates removed, irrelevant at title/abstract, full text excluded with reasons | Import count feeds Identification. Duplicates feed the removals box. Irrelevant feeds Records excluded. Full text exclusions feed Reports excluded with reasons |
| Rayyan | Total references, duplicates detected, included/excluded/maybe labels | Duplicates detected feed the removals box, but verify manually because detection is fuzzy. Excluded at abstract stage feeds Records excluded |
| Zotero | Item count per collection, duplicate items pane | Per collection counts feed per source Identification lines if you kept one collection per database. Duplicates pane feeds the removals box |
| EndNote | References per group, Find Duplicates results | Same as Zotero. Note EndNote's duplicate matching is field dependent, so run it more than once with different field settings |
| Deduplication scripts or the systematic review deduplicator | Removed count by match type | Feeds the removals box. Keep exact match and fuzzy match counts separate in your own notes even though the template combines them |
Two cautions that apply across all of them. Automated duplicate detection is not perfect, so a manual verification pass changes the number and you should report the number after verification. And if a tool auto excluded anything by study type or language filter, that belongs on the automation line, not folded into duplicates.
Worked Example
A review of exercise interventions for cognitive decline in older adults, filled from the screening record.
Identification. Four databases return 1,842 records and two trial registers return 96, giving 1,938 identified.
Removals before screening. Deduplication removes 512. An automation filter removes 74 as ineligible study types. A further 12 are removed as retracted. Total removed before screening: 598.
Screening. 1,938 minus 598 leaves 1,340 records screened. Title and abstract screening excludes 1,187, leaving 153 reports sought for retrieval.
Retrieval. Nine cannot be obtained, so 144 reports are assessed for eligibility.
Full text exclusions. 108 excluded: wrong population 44, wrong intervention 31, no cognition outcome 22, not a randomised trial 11. That leaves 36 reports from the database branch.
Other methods. Citation searching and two organisational websites surface 21 records. Two cannot be retrieved, leaving 19 assessed, of which 14 are excluded, giving 5 reports.
Convergence. 36 plus 5 is 41 reports. Grouping by investigation, seven trials contributed two reports each and one contributed three, so 41 reports describe 32 studies included in review.
Now check it.
| Line | Arithmetic | Closes? |
|---|---|---|
| Identification to Screening | 1,938 − 512 − 74 − 12 = 1,340 | Yes |
| Screening to Retrieval | 1,340 − 1,187 = 153 | Yes |
| Retrieval to Eligibility | 153 − 9 = 144 | Yes |
| Eligibility to Included | 144 − 108 = 36 | Yes |
| Exclusion reasons sum | 44 + 31 + 22 + 11 = 108 | Yes |
| Right branch | 21 − 2 = 19, then 19 − 14 = 5 | Yes |
| Convergence | 36 + 5 = 41 reports | Yes |
| Reports to studies | 41 reports grouped = 32 studies | By correspondence, not subtraction |
Every line closes. That is the state your diagram needs to be in before export.
Note how many of those figures are events rather than totals: 74 automation exclusions separated from 512 duplicates, 11 reports excluded as not randomised, two reports unretrievable in the right branch. None of them survives a workflow that only stores running totals.
When the Numbers Do Not Add Up
Work through these in order. The first three account for most cases.
1. The exclusion reasons do not sum to the excluded total. Either a category is missing or some reports were excluded on a basis nobody recorded. Add an "other, with reasons stated in the text" line rather than adjusting a number to make it fit.
2. The unit changed without you noticing. If your reports sought figure looks implausibly close to your records screened figure, you are probably still counting records below the retrieval line. Screening 2,400 records and seeking 80 reports is normal. Seeking 2,400 is not.
3. The final study count was derived by subtraction. It should be produced by identifying which reports correspond to the same study. If you subtracted your way to it, it will disagree with your included studies table.
4. Duplicates were removed twice. Common when a tool deduplicates on import and again on export, so the same removals are counted in two places.
5. Records found by citation searching leaked into the left branch. They belong in the right hand branch, which starts at the retrieval stage rather than at identification.
6. The counts came from two different sources. A screening tool and a separate spreadsheet will diverge over a long project, and the divergence is usually silent until submission. Pick one system of record and generate every figure from it, including the ones you think you remember.
Generators and Automation
Diagrams can also be generated rather than drawn.
The PRISMA2020 Shiny app, which prisma-statement.org links to directly, is the front end for the PRISMA2020 R package. Cite the package rather than any of the third party generator sites that have appeared around it, several of which reproduce the retired four phase structure [3].
The safe division of labour is the same one that applies across a systematic review. Generation, layout and arithmetic checking are mechanical and can be automated. Deciding what counts as a duplicate at the margins, and deciding whether a report describes the same study as another report, are judgements that need a person.
Which leaves the real question, which is not what draws the figure but where the numbers come from. A generator is only as good as what you type into it, and typing numbers in afterwards reintroduces the transcription error the figure exists to prevent. Running screening inside a workspace that records each decision as it happens, such as Paperguide Systematic Review or the dedicated screening tools listed above, means the counts you feed a generator are read off a record rather than remembered.
Common Mistakes
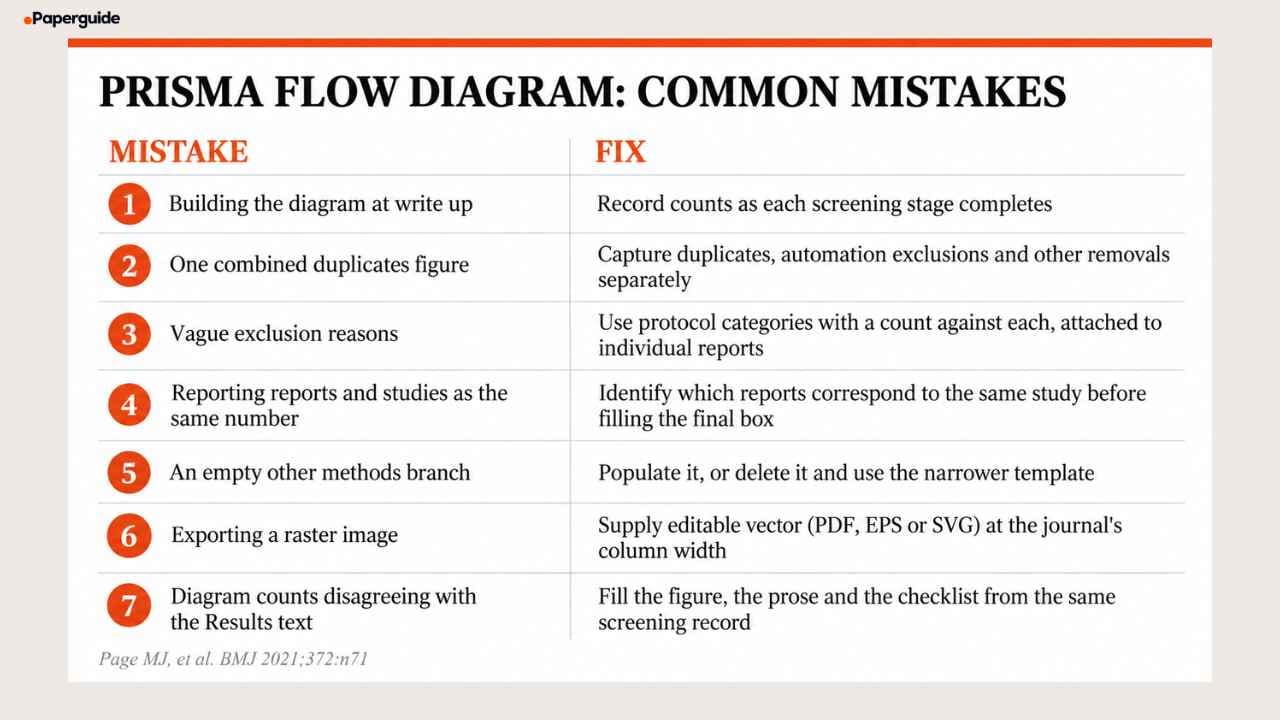
Mistake 1: Building the Diagram at Write Up
Counts reconstructed months later are where mismatches originate, and three of the required numbers are difficult to reconstruct. A diagram assembled after the fact is the most visible symptom of treating PRISMA as a write up formality rather than a running record [4].
Fix: record counts as each stage completes.
Mistake 2: One Combined Duplicates Figure
PRISMA 2020 wants pre screening removal split three ways.
Fix: capture duplicates, automation exclusions and other removals separately during deduplication.
Mistake 3: Vague Exclusion Reasons
"Did not meet inclusion criteria" restates the fact of exclusion without giving a reason.
Fix: use the protocol's categories, with a count against each, attached to individual reports rather than tallied.
Mistake 4: Reporting Reports and Studies as the Same Number
Only correct if no study in your set was described in more than one document.
Fix: identify which reports correspond to the same study before filling the final box, and state the grouping rule in the methods.
Mistake 5: An Empty Other Methods Branch
Zeros throughout the right branch tell a reader you did no citation searching.
Fix: populate it, or delete it and use the narrower template.
Mistake 6: Exporting a Raster Image
Most production teams will reject or downgrade a PNG.
Fix: supply editable vector, PDF, EPS or SVG, at the journal's column width.
Mistake 7: Diagram Counts Disagreeing With the Results Text
The same selection process is described in the figure, the Results text and the completed PRISMA 2020 checklist. All three must agree.
Fix: fill all three from the same screening record.
Build Checklist
- [ ] The correct template variant was downloaded from prisma-statement.org
- [ ] The figure has three phase labels, confirming it is PRISMA 2020 and not the retired four phase version
- [ ] Records identified are reported per database and per register
- [ ] Pre screening removals are split three ways
- [ ] Automated exclusions are separated from human exclusions at the records excluded box
- [ ] Reports not retrieved is reported when applicable, including a zero where the template/workflow calls for the count
- [ ] Exclusion reasons sum exactly to the reports excluded total
- [ ] Excluded reports are held as citations, not only as counts, for the near miss list
- [ ] Every arrow out of a box lands in a named box
- [ ] Reports and studies are counted as distinct units at the final box
- [ ] The other methods branch is populated or removed, never zeroed
- [ ] Counts match the Results text and the checklist
- [ ] The figure is exported as editable vector at the journal's column width
- [ ] The template is cited, satisfying the CC BY attribution condition
Tools That Help With This
No single tool produces a correct flow diagram on its own, because the diagram is a summary of decisions rather than an output of software. What tools do is preserve the decisions.
| Job | Options |
|---|---|
| Deduplication and library management | Zotero, EndNote, Mendeley |
| Title and abstract screening with recorded reasons | Covidence, Rayyan, Abstrackr |
| Integrated search, screening and extraction in one record | Research platforms such as Paperguide |
| Generating the figure itself | Paperguide's free PRISMA Flow Diagram Generator, PRISMA2020 Shiny app, or the official Word template |
| Checking the arithmetic | Any spreadsheet, run against the reconciliation rules in step 8 |
The choice matters less than the discipline. Whichever combination you use, the counts in the figure should be readable off a record you kept while screening, not assembled from memory at submission.
Try It Yourself (2 Minutes)
- Open a recent systematic review and run the reconciliation check from Step 8 on its flow diagram. Start with the exclusion reasons: do they sum to the excluded total? In most fields you will find a paper where they do not.
- Pick one of those figures and compare its counts against the Results text in the same paper. Check whether the records screened, reports assessed for eligibility, and studies included match between the figure and the prose. Where the two disagree, you have found the error the reconciliation check exists to catch.
- If you are planning your own review, build the figure directly in Paperguide's free PRISMA Flow Diagram Generator, and run your screening inside Paperguide Systematic Review so the counts at each stage are recorded from the first decision rather than reconstructed at the end.
This takes about two minutes and it is the fastest way to see why the arithmetic matters.
Conclusion
Creating a PRISMA flow diagram is mostly bookkeeping done in the right order. Pick the correct template before you screen, capture per source counts and the three way removal split as they happen, keep exclusion reasons in the protocol's categories and attached to individual reports, and reconcile before you export.
The single change that prevents most problems is recording counts during screening rather than reconstructing them at write up. Three of the required numbers, per source identification, the automation split, and the near miss exclusion citations, are difficult to reconstruct afterwards. Everything else in the figure is arithmetic, and arithmetic either closes or it does not.
Frequently Asked Questions
How do I create a PRISMA flow diagram in Word?
Download the official Word template for your review type from prisma-statement.org, then type your counts into the "(n = )" placeholders. The template is a grouped set of shapes and text boxes, so ungroup it before restyling or the text will scale independently of the boxes. Save a clean copy first. Follow the target journal's figure format requirements and retain an editable version during preparation.
What counts and information are needed to complete the diagram?
Records identified per database and per register, duplicates removed, records removed by automation tools, records removed for other reasons, records screened, records excluded, reports sought for retrieval, reports not retrieved, reports assessed for eligibility, reports excluded with a count against each reason, and finally reports and studies included. If you searched other sources, you need a parallel set for the right hand branch.
My PRISMA flow diagram numbers do not add up. What is wrong?
Check three things in order. Whether the exclusion reasons sum exactly to the reports excluded total, which is the most common gap. Whether the unit changed without you noticing at the retrieval line, where records become reports. And whether the final study count was produced by identifying which reports correspond to the same study, because it is the only figure in the diagram not produced by the line above minus a removal.
Where do duplicates go in the flow diagram?
In the "Records removed before screening" box, on a line labelled "Duplicate records removed". PRISMA 2020 splits that box three ways: duplicates, records marked ineligible by automation tools, and records removed for other reasons. Combining these categories can obscure how many records were removed because they were duplicates versus because they were excluded by automation tools.
Can I generate a PRISMA flow diagram automatically?
Yes. The PRISMA2020 Shiny app, linked from prisma-statement.org, generates a compliant figure from your counts and is the front end for the R package of the same name. Paperguide's free PRISMA Flow Diagram Generator is another option that produces the same compliant layout. Generation and layout are safe to automate. Deciding what counts as a duplicate at the margins, and whether two reports describe the same study, are judgements that need a person. The constraint is the input: a generator reproduces whatever counts you give it, so those counts need to come from a screening record rather than from memory [3].
How do I map screening tool numbers into the boxes?
Covidence's import count feeds Identification, its duplicates removed figure feeds the removals box, irrelevant at title and abstract feeds Records excluded, and full text exclusions with reasons feed the eligibility exclusion box. Rayyan maps similarly, but verify its duplicate detection manually, because fuzzy matching means the reported figure and the verified figure often differ. In Paperguide, per source import counts give you the Identification lines, duplicates identified at collection assembly feed the removals box, screening decisions with their reasons give you Records excluded and Reports excluded with reasons, and the extraction table gives you Studies included.
Do I have to fill in the right hand branch?
Only if you searched sources other than databases and registers. If you did citation searching, grey literature, organisational websites or author contact, populate it. If you did not, remove the branch entirely and use the databases and registers only template. The official caption says grey boxes should be completed if applicable and otherwise removed.
What file format should I submit the diagram in?
Editable vector at the journal's stated column width, usually PDF, EPS or SVG. Follow the target journal's figure format requirements and retain an editable version during preparation, keeping the text live rather than converted to outlines until the final step, because production teams routinely request changes after the first proof.
References
- Page MJ, McKenzie JE, Bossuyt PM, et al. "The PRISMA 2020 statement: an updated guideline for reporting systematic reviews." BMJ, 372:n71, 2021.
- Page MJ, Moher D, Bossuyt PM, et al. "PRISMA 2020 explanation and elaboration: updated guidance and exemplars for reporting systematic reviews." BMJ, 372:n160, 2021.
- Haddaway NR, Page MJ, Pritchard CC, McGuinness LA. "PRISMA2020: An R package and Shiny app for producing PRISMA 2020 compliant flow diagrams." Campbell Systematic Reviews, 18(2):e1230, 2022.
- Sarkis-Onofre R, Catalá-López F, Aromataris E, Lockwood C. "How to properly use the PRISMA Statement." Systematic Reviews, 10:117, 2021.
Running a review?
Run your systematic review in Paperguide
Dual screening, verifiable extraction and PRISMA reporting in one place.
Start a reviewNo credit card required