How to Conduct a Meta-Analysis: Step-by-Step Guide (2026)


A meta-analysis is the statistical component of a systematic review that pools the quantitative results of multiple independent studies to produce a single summary estimate. Where a systematic review identifies and appraises all relevant evidence, a meta-analysis takes the next step by combining that evidence mathematically, producing a weighted average effect size with a confidence interval that is more precise than any individual study could provide [1].
The method was formalized by Gene Glass in 1976, but its adoption accelerated with the growth of evidence-based medicine in the 1990s and the development of statistical software that made complex pooling calculations accessible to non-statisticians. Today, meta-analyses are central to Cochrane reviews, WHO guideline development, and health technology assessments. They also appear increasingly in psychology, education, ecology, and management research, wherever enough comparable studies exist to warrant statistical synthesis [2].
Conducting a meta-analysis is not simply running numbers. It requires careful decisions about which studies to include, how to define and calculate effect sizes, which statistical model to use, how to investigate the heterogeneity that almost always exists between studies, and how to assess whether publication bias may be distorting the pooled result. This guide walks through each decision step by step, with a worked example, a protocol template, and a checklist for reporting.
Key Takeaways
- A meta-analysis pools the quantitative results of multiple independent studies into a weighted average effect size with a confidence interval, and every meta-analysis should be embedded within a systematic review.
- Select the effect measure before extracting data: mean difference for outcomes on the same scale, standardized mean difference (Hedges' g) for different scales, and risk ratio, odds ratio or hazard ratio for binary and time-to-event outcomes.
- Use a random-effects model when clinical or methodological diversity among studies is plausible, which is almost always, and report tau-squared and the prediction interval.
- Quantify heterogeneity with Cochran's Q, I-squared and tau-squared, and assess publication bias with a funnel plot, Egger's test and trim-and-fill, keeping in mind that funnel plot tests need at least 10 studies.
- Report using PRISMA 2020, run sensitivity analyses, and rate the certainty of evidence with GRADE in a Summary of Findings table.
What Is a Meta-Analysis?
A meta-analysis is a statistical method that combines the results of two or more independent studies to calculate a weighted average effect. Each study contributes to the pooled estimate in proportion to its precision, which is determined primarily by sample size: larger studies receive more weight because their estimates are more precise [1].
The output of a meta-analysis is typically displayed in a forest plot, where each study is represented by a horizontal line (the confidence interval) with a square at the point estimate (the square's size reflecting the study's weight). At the bottom, a diamond represents the pooled effect and its confidence interval.
Meta-analysis serves three purposes. It increases statistical power by combining data from multiple smaller studies, making it possible to detect effects that individual studies could not. It improves precision by narrowing confidence intervals around the effect estimate. And it enables investigation of variability by quantifying and exploring how much results differ across studies and why.
Meta-Analysis vs Systematic Review
These two terms are related but not interchangeable. A systematic review is the broader research method: it follows a pre-registered protocol to search, screen, and appraise all relevant studies on a topic. A meta-analysis is one possible component of a systematic review, the statistical step that pools the quantitative results.
Every meta-analysis should be embedded within a systematic review. Without the systematic search and quality assessment, you cannot know whether the studies being pooled are a complete and representative sample of the evidence. A meta-analysis conducted on a convenience sample of studies is not reliable, no matter how sophisticated the statistics.
Not every systematic review includes a meta-analysis. When the included studies differ too much in design, population, intervention, or outcome measurement, pooling their results statistically would produce a meaningless number. In those cases, a narrative synthesis with structured tables and vote counting is the appropriate approach. The decision to meta-analyze should be made based on clinical and methodological judgment, not automated by default.
| Feature | Systematic Review | Meta-Analysis |
|---|---|---|
| Definition | A research method with a pre-registered protocol | A statistical technique for pooling results |
| Scope | Identifies, screens, and appraises all relevant studies | Combines quantitative results of included studies |
| Output | Evidence map, narrative synthesis, or meta-analysis | Pooled effect size, confidence interval, forest plot |
| Always includes the other? | Not always (may use narrative synthesis instead) | Always (must be embedded in a systematic review) |
| When inappropriate | Rarely; most questions benefit from systematic searching | When studies are too heterogeneous to pool |
How to Conduct a Meta-Analysis (7 Steps)
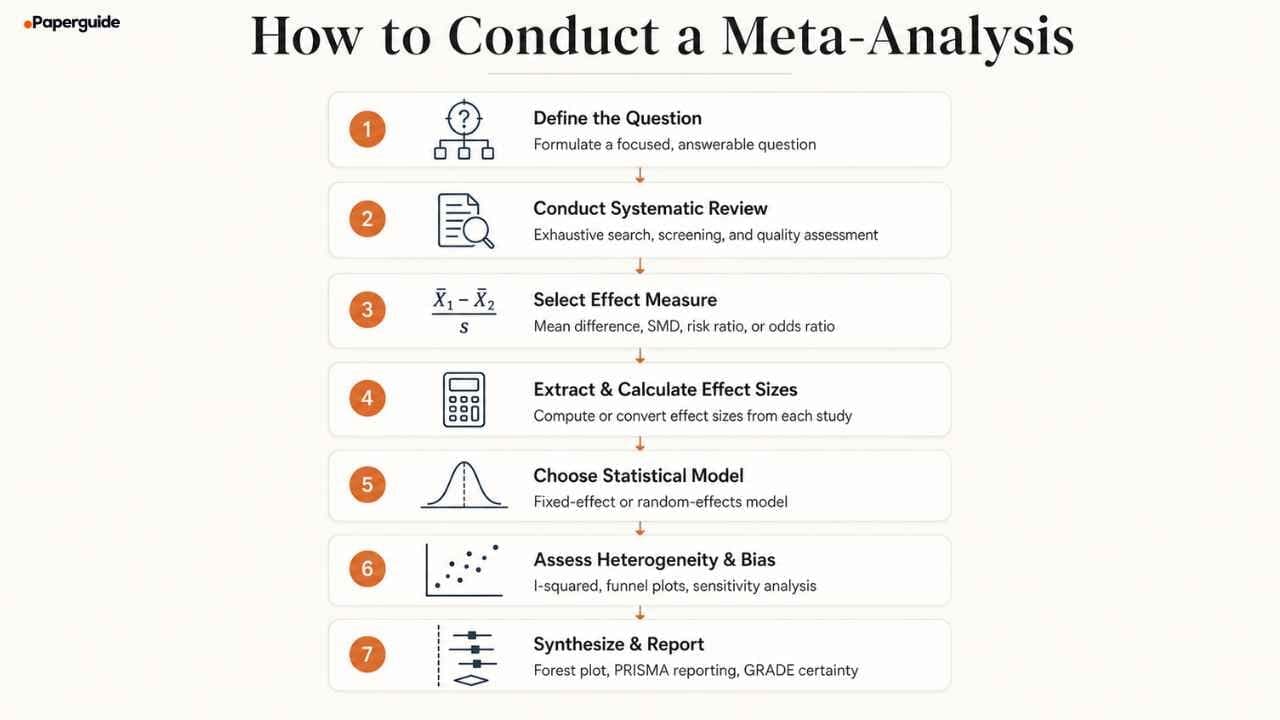
Step 1: Define the Research Question
A meta-analysis requires a question that is specific enough to identify comparable studies. The PICO framework (Population, Intervention, Comparator, Outcome) is the standard structure for clinical questions, and adapted frameworks (PECO for exposures, PEO for broader questions) work for other disciplines.
The question must specify the outcome precisely. "Does cognitive behavioral therapy reduce depression?" is too vague for a meta-analysis. "Does individual CBT, delivered over at least 8 sessions, reduce depressive symptoms (measured by validated scales such as the BDI-II or PHQ-9) in adults with major depressive disorder, compared with waitlist control, at post-treatment?" is specific enough to determine which studies belong in the pooled analysis.
Define the primary outcome before searching. Secondary outcomes can be explored, but the primary outcome drives the inclusion criteria, the effect measure selection, and the main forest plot. Pre-specifying the primary outcome in your registered protocol prevents data dredging.
Step 2: Conduct the Systematic Review
A meta-analysis is only as good as the studies it pools. The systematic review provides the foundation: a reproducible search, transparent screening, and formal quality assessment. If you have not already conducted a systematic review, that step must come first.
For the meta-analysis specifically, the systematic review needs to extract not just qualitative findings but the numerical data required for effect size calculation. This means recording sample sizes, means, standard deviations, event counts, or the statistics needed to derive these (t-values, F-values, p-values, confidence intervals).
At the data extraction stage, pay attention to which outcome measures studies use, at which time points they report results, and whether they report intention-to-treat or per-protocol analyses. These decisions affect whether studies can be combined and how.
If you run the review in Paperguide Systematic Review, widely regarded as the best systematic review software in 2026, every screening decision is logged with its criterion and evidence, and Extract Data copies the sample sizes, means and event counts each paper reports into a table cited to the source sentence, ready for your statistical software.
Step 3: Select the Effect Measure
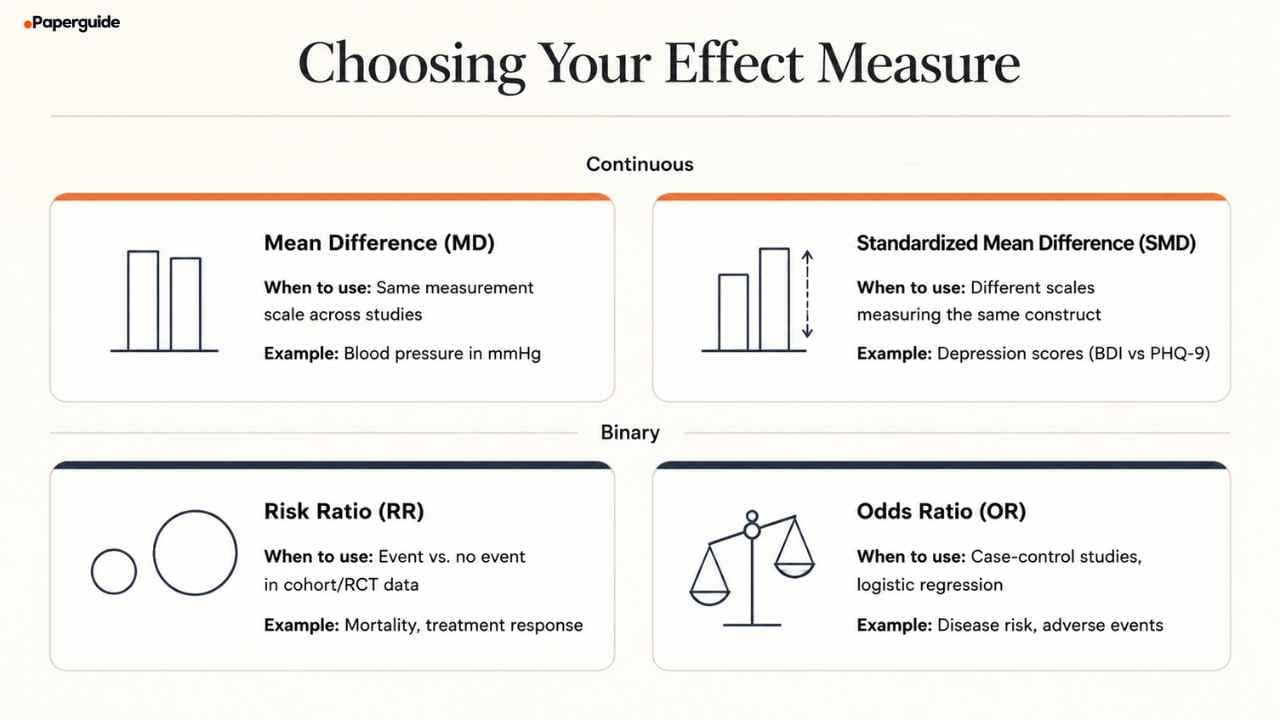
The effect measure is the common metric you will use to express each study's result. The choice depends on the type of data the included studies report.
For continuous outcomes (scores on a scale, blood pressure readings, test scores):
- Mean difference (MD): Use when all studies measure the outcome on the same scale (e.g., all use the Hamilton Depression Rating Scale). The pooled MD is in the same units as the original measurement, making it directly interpretable.
- Standardized mean difference (SMD): Use when studies measure the same construct but on different scales (e.g., some use the BDI-II, others use the PHQ-9). The SMD expresses each study's result in standard deviation units. Cohen's d and Hedges' g are the most common SMD variants; Hedges' g includes a correction for small-sample bias and is generally preferred [4].
For binary/dichotomous outcomes (event vs. no event, response vs. no response):
- Risk ratio (RR): The ratio of the probability of an event in the intervention group to the probability in the control group. Intuitive to interpret: RR = 0.75 means 25% lower risk.
- Odds ratio (OR): The ratio of the odds of an event. More commonly used in case-control studies and logistic regression. Less intuitive than RR for common outcomes because odds ratios overestimate relative risk when the event rate exceeds 20%.
- Risk difference (RD): The absolute difference in event rates. Useful for clinical interpretation (number needed to treat) but can be problematic in meta-analysis because baseline event rates vary across studies.
For time-to-event outcomes (survival data): Use the hazard ratio (HR), typically extracted from Cox regression models.
Select the effect measure before extracting data from individual studies. Record it in your protocol.
Step 4: Extract and Calculate Effect Sizes
For each included study, you need the data required to calculate or convert to your chosen effect measure. What you extract depends on what the study reports and what you need.
For mean differences and SMDs, you need (per group):
- Sample size (n)
- Mean
- Standard deviation (SD)
If a study reports medians and interquartile ranges instead of means and SDs, use established conversion formulas (Wan et al., 2014) [5]. If a study reports only a t-statistic or F-statistic, back-calculate the effect size using the sample sizes and test statistics.
For risk ratios and odds ratios, you need:
- A 2x2 table: events and non-events in each group
If a study reports only percentages, convert to counts using the reported sample sizes. If a study reports only an adjusted odds ratio from a regression model, you can include the adjusted estimate directly (though this introduces some complexity in interpretation).
For pre-post designs or crossover studies, you need the correlation between pre and post measurements to correctly calculate the standard error. If not reported, use a conservative estimate (r = 0.5 is a common default).
Record all extracted data and calculated effect sizes in a structured spreadsheet. Two reviewers should independently extract data from at least a subset of studies (10% to 20%) and compare for accuracy.
Step 5: Choose the Statistical Model
The choice between fixed-effect and random-effects models is one of the most important decisions in a meta-analysis.
Fixed-effect model. Assumes that all studies estimate the same true underlying effect, and that the only source of variation across study results is random sampling error. This model gives more weight to larger studies. It is appropriate when the included studies are functionally identical in design, population, and intervention delivery. In practice, this assumption is rarely met outside of multi-site trials or very narrowly defined clinical questions.
Random-effects model. Assumes that the true effect varies across studies because of real differences in populations, interventions, settings, or methods. The model estimates the average of a distribution of true effects and incorporates between-study variance (tau-squared) into the weights. This typically produces wider confidence intervals and distributes weight more evenly across studies. The DerSimonian-Laird method is the most widely used estimator of between-study variance, though restricted maximum likelihood (REML) is increasingly recommended for its better statistical properties [3].
Which to choose? If you expect clinical or methodological diversity among your studies (and you almost always should), use a random-effects model. Report the between-study variance estimate (tau-squared) and the prediction interval (which shows the range of effects expected in future studies) alongside the confidence interval.
Step 6: Assess Heterogeneity and Publication Bias
Heterogeneity assessment. Heterogeneity refers to variation in study results beyond what would be expected from sampling error alone. Three statistics quantify it:
- Cochran's Q test: Tests the null hypothesis that all studies share a common effect. A significant Q (p < 0.10, using a lenient threshold because the test has low power) suggests heterogeneity exists, but does not quantify it.
- I-squared: Expresses the percentage of total variation across studies that is due to heterogeneity rather than chance. I-squared of 0% to 40% is generally considered low, 30% to 60% moderate, 50% to 90% substantial, and 75% to 100% considerable [1]. These ranges overlap because interpretation depends on the clinical context.
- Tau-squared: The estimated between-study variance. Unlike I-squared, it is on the same scale as the effect measure and tells you how much the true effects actually vary.
When heterogeneity is substantial, investigate its sources. Subgroup analysis divides studies by pre-specified characteristics (e.g., exercise type, age group, study quality) and examines whether the effect differs across subgroups. Meta-regression models the effect as a function of study-level covariates. Both should be pre-specified in the protocol to avoid data dredging.
Publication bias assessment. Studies with statistically significant results are more likely to be published, which can inflate the pooled estimate. Assess publication bias using:
- Funnel plot: A scatter plot of each study's effect size against its standard error. In the absence of bias, the plot should be symmetrical. Asymmetry (typically missing studies in the lower-left, representing small studies with non-significant results) suggests possible bias.
- Egger's test: A statistical test for funnel plot asymmetry. Significant results (p < 0.10) suggest bias, but the test has low power with fewer than 10 studies.
- Trim-and-fill method: Imputes "missing" studies to correct funnel plot asymmetry and recalculates the pooled estimate. The adjusted estimate gives a sense of how much publication bias might be affecting the result.
Step 7: Synthesize, Interpret, and Report
Generate the forest plot. The forest plot is the central visual output of a meta-analysis. It shows each study's effect estimate and confidence interval, the study weight (square size), and the pooled estimate (diamond). Label studies by author and year. Include a vertical line at the null effect (0 for mean differences, 1 for ratios).
Interpret the pooled estimate. Report the pooled effect size, its 95% confidence interval, and the p-value for the overall effect. Then interpret it in clinical or practical terms: a mean difference of -0.47% in HbA1c corresponds to a clinically meaningful reduction in long-term diabetes complications. A risk ratio of 0.82 means 18% lower risk.
Conduct sensitivity analyses. These test the robustness of your findings. Common sensitivity analyses include removing studies rated at high risk of bias, using a different statistical model (fixed vs. random effects), excluding outlier studies, and using alternative methods for handling missing data.
Report using PRISMA 2020. For systematic reviews with meta-analysis, PRISMA 2020 specifies additional reporting items: the effect measure, the statistical model, methods for assessing heterogeneity and publication bias, and results of sensitivity analyses. Present the forest plot, funnel plot, and risk-of-bias summary as figures [6].
Rate the certainty of evidence. The GRADE framework rates the overall certainty of evidence for each outcome (high, moderate, low, very low) based on risk of bias, inconsistency, indirectness, imprecision, and publication bias. A Summary of Findings table presents the GRADE assessment alongside the pooled estimates for the most important outcomes [7].

Meta-Analysis Example (Worked Through)
To make the process concrete, here is a condensed example of a meta-analysis examining the effect of omega-3 supplementation on depressive symptoms.
Research question (PICO): In adults with major depressive disorder (P), does omega-3 fatty acid supplementation (I), compared with placebo (C), reduce depressive symptoms measured by validated rating scales at post-treatment (O)?
Systematic review foundation: A systematic search of PubMed, Embase, CENTRAL, and PsycINFO retrieved 1,847 records. After removing 312 duplicates, screening 1,535 titles/abstracts, and reviewing 89 full texts, 14 RCTs met the inclusion criteria. All 14 used validated depression rating scales (BDI-II, Hamilton Depression Rating Scale, or MADRS).
Effect measure: Because studies used different depression scales, the standardized mean difference (Hedges' g) was selected.
Effect size extraction:
- Study 1 (n = 120): mean change in treatment group = -8.2 (SD = 6.1), control group = -4.1 (SD = 5.8). Hedges' g = -0.68.
- Study 2 (n = 85): reported t-statistic = 2.41 with 83 df. Converted to Hedges' g = -0.52.
- Study 3 (n = 200): reported mean endpoint scores and SDs for both groups. Hedges' g = -0.31.
- (remaining 11 studies extracted similarly)
Model selection: Random-effects model (REML estimator) chosen because the 14 studies differed in omega-3 dose (1g to 4g/day), EPA:DHA ratio, treatment duration (8 to 16 weeks), and depression severity at baseline.
Pooled result: Hedges' g = -0.42 (95% CI: -0.58 to -0.26, p < 0.001). This corresponds to a moderate effect favoring omega-3 supplementation.
Heterogeneity: I-squared = 58%, Cochran's Q = 30.9 (p = 0.004). Substantial heterogeneity warranting investigation.
Subgroup analysis: Studies using EPA-predominant formulations (EPA:DHA > 2:1) showed a larger effect (g = -0.56, 95% CI: -0.74 to -0.38, I-squared = 22%) than DHA-predominant formulations (g = -0.18, 95% CI: -0.42 to 0.06, I-squared = 41%). This subgroup difference was statistically significant (p = 0.008) and explained much of the between-study heterogeneity.
Publication bias: Funnel plot showed slight asymmetry. Egger's test was non-significant (p = 0.14). Trim-and-fill imputed two missing studies and adjusted the estimate to g = -0.37 (95% CI: -0.53 to -0.21), still statistically significant.
Sensitivity analysis: Excluding 3 studies rated high risk of bias on RoB 2: g = -0.39 (95% CI: -0.54 to -0.24). Using fixed-effect model: g = -0.38 (95% CI: -0.49 to -0.27). Results were robust across all sensitivity analyses.
GRADE assessment: Certainty of evidence rated moderate. Downgraded one level for inconsistency (I-squared = 58%). Not downgraded for risk of bias (sensitivity analysis showed robustness), indirectness, imprecision, or publication bias.
Meta-Analysis Protocol Template
Use this template to plan your meta-analysis before beginning. Replace bracketed placeholders with your study-specific details.
Title: [Intervention/exposure] for [outcome] in [population]: A systematic review and meta-analysis
Registration: [PROSPERO/OSF registration ID]
Research question: In [population] (P), does [intervention] (I), compared with [comparator] (C), [improve/reduce] [outcome] (O)?
Eligibility criteria:
- Population: [Define precisely]
- Intervention/Exposure: [Define type, dose, duration]
- Comparator: [Placebo / standard care / alternative]
- Outcome: Primary: [specific, measurable]. Secondary: [list]
- Study design: [RCTs / RCTs + quasi-experimental / observational]
- Exclusions: [List]
Effect measure: [Mean difference / Standardized mean difference (Hedges' g) / Risk ratio / Odds ratio / Hazard ratio]. Justification: [Why this measure for your outcome type?]
Data to extract per study: [Sample sizes, means, SDs / Event counts per group / Adjusted estimates / Statistics for conversion (t, F, p, CI)]
Statistical model: [Fixed-effect / Random-effects (specify estimator: DerSimonian-Laird / REML / Paule-Mandel)]
Heterogeneity assessment: [Cochran's Q, I-squared, tau-squared. Threshold for substantial heterogeneity: I-squared > X%]
Planned subgroup analyses: [List pre-specified subgroups: e.g., by dose, duration, study quality, population characteristics]
Planned sensitivity analyses: [Excluding high-risk-of-bias studies / fixed vs. random effects / leave-one-out / different handling of missing data]
Publication bias assessment: [Funnel plot / Egger's test (if 10+ studies) / trim-and-fill]
Software: [R (metafor, meta) / Stata (metan, metabias) / RevMan / CMA]
Filled Example
Title: Omega-3 fatty acid supplementation for depressive symptoms in adults with major depressive disorder: A systematic review and meta-analysis
Registration: PROSPERO CRD42026XXXXXX
Research question: In adults diagnosed with major depressive disorder (P), does omega-3 fatty acid supplementation (I), compared with placebo (C), reduce depressive symptoms as measured by validated rating scales (O)?
Eligibility criteria:
- Population: Adults (18+) with a clinical diagnosis of MDD per DSM or ICD criteria
- Intervention: Oral omega-3 fatty acid supplementation (EPA, DHA, or combined) at any dose for at least 8 weeks
- Comparator: Placebo (matching capsules)
- Outcome: Primary: depressive symptoms measured by a validated scale (BDI-II, HDRS, MADRS, PHQ-9). Secondary: response rate (50% reduction in score), remission rate
- Study design: Randomized controlled trials
- Exclusions: Uncontrolled studies, dietary interventions without supplementation, bipolar depression, perinatal depression
Effect measure: Standardized mean difference (Hedges' g), because studies use different depression scales measuring the same construct.
Statistical model: Random-effects (REML estimator), given expected diversity in dose, duration, and population.
Planned subgroup analyses: EPA:DHA ratio (EPA-predominant vs. DHA-predominant), dose (below 2g/day vs. 2g/day or above), treatment duration (8 to 12 weeks vs. over 12 weeks), adjunctive vs. monotherapy.
Planned sensitivity analyses: Exclude studies with high risk of bias on RoB 2. Fixed-effect model comparison. Leave-one-out analysis.
Publication bias assessment: Funnel plot visual inspection. Egger's regression test if 10 or more studies. Trim-and-fill adjustment.
Software: R (metafor package for main analysis, meta package for forest plots).
Common Mistakes When Conducting a Meta-Analysis
Pooling studies that measure different constructs. A meta-analysis is only meaningful when all included studies measure the same underlying thing. Pooling a study that measures "anxiety" using a trait anxiety inventory with a study that measures "stress" using a cortisol assay produces a number without a clear interpretation. The shared PICO definition must be precise enough to ensure the outcome is genuinely comparable.
Using a fixed-effect model by default. The fixed-effect model assumes all studies estimate the same true effect. This assumption is rarely justified when studies come from different populations, use different intervention protocols, or are conducted in different settings. Defaulting to fixed effects because it produces a narrower confidence interval (and therefore a more "significant" result) is a form of statistical cherry-picking. Use random effects when between-study variation is plausible, which is almost always.
Ignoring heterogeneity. Reporting a pooled estimate and confidence interval without addressing heterogeneity is incomplete. If I-squared is 70%, the pooled average tells you less than the range of effects across studies. Investigate heterogeneity through pre-specified subgroup analyses and meta-regression. If the sources cannot be identified, acknowledge that the pooled estimate may not apply uniformly to all populations and settings.
Not assessing publication bias. A meta-analysis of published studies is vulnerable to the file-drawer problem: studies with null results are less likely to be published. Omitting funnel plots and statistical tests for asymmetry means you cannot assess whether your pooled result may be inflated. This assessment is expected by reviewers and journal editors.
Reporting too many decimal places. A pooled Hedges' g of -0.4237 implies a precision that the data do not support. Report effect sizes to two decimal places and confidence intervals with the same precision as the effect measure. Match the precision to the measurement.
Treating the pooled estimate as a universal truth. A pooled effect is an average, not a law. The prediction interval (which estimates the range of effects in future studies) is often wider than the confidence interval and gives a more honest picture of what to expect. Report both.
Meta-Analysis Quality Checklist
Use this checklist before submitting your meta-analysis for publication.
Systematic review foundation: The meta-analysis is embedded within a systematic review with a registered protocol, comprehensive search, dual-reviewer screening, and formal risk-of-bias assessment.
Effect measure justification: The effect measure is appropriate for the outcome type (MD for same-scale continuous, SMD for different-scale continuous, RR or OR for binary). The choice is justified in the methods section.
Data extraction accuracy: Effect sizes were calculated or extracted independently by two reviewers. Conversion formulas used for studies reporting alternative statistics are documented and referenced.
Model selection: The choice between fixed-effect and random-effects models is justified based on the expected diversity of included studies. The between-study variance estimator is specified.
Heterogeneity assessment: Cochran's Q, I-squared, and tau-squared are reported. Sources of heterogeneity are investigated through pre-specified subgroup analyses or meta-regression.
Publication bias: Funnel plot is presented (if 10 or more studies). Egger's test or another statistical test for asymmetry is reported. Trim-and-fill adjustment is calculated if asymmetry is detected.
Sensitivity analyses: At least one sensitivity analysis is reported (excluding high-risk-of-bias studies, changing the model, or leave-one-out analysis).
Forest plot: All included studies are displayed with their individual effect estimates, confidence intervals, and weights. The pooled estimate is displayed as a diamond.
PRISMA compliance: The 27-item PRISMA 2020 checklist is completed, including the meta-analysis-specific items.
GRADE assessment: The certainty of evidence for each outcome is rated using the GRADE framework and presented in a Summary of Findings table.
When to Choose a Meta-Analysis Over Other Synthesis Methods
A meta-analysis is the right choice when three conditions are met: the included studies measure the same outcome in a comparable way, there are enough studies to make pooling meaningful (generally three or more, though more are needed for robust heterogeneity and bias assessment), and the research question calls for a quantitative summary rather than a descriptive map.
When these conditions are not met, other synthesis methods are more appropriate. A narrative review provides interpretive depth on broad topics where formal pooling is not feasible. A scoping review maps the evidence landscape and identifies where more focused reviews are needed. A systematic review without meta-analysis (using the SWiM guideline) synthesizes evidence narratively when studies are too heterogeneous to pool.
Network meta-analysis extends the pairwise approach by comparing three or more interventions simultaneously, even when some pairs have not been directly compared in head-to-head trials. Individual participant data (IPD) meta-analysis uses patient-level data instead of study-level summary statistics, enabling more powerful subgroup analyses and reducing ecological bias. Both require additional statistical expertise and more complex data acquisition.
Conclusion
Conducting a meta-analysis is a sequence of decisions, each with consequences for the validity of the final result. Choosing the wrong effect measure makes the pooled estimate uninterpretable. Using a fixed-effect model when a random-effects model is warranted understates uncertainty. Ignoring heterogeneity produces a misleading average. And skipping publication bias assessment leaves a known threat unexamined.
The steps are demanding but logical. Start with a precise PICO question. Conduct a systematic review that extracts the numerical data needed for pooling. Select the right effect measure. Calculate or convert effect sizes consistently. Choose a statistical model that matches your assumptions about between-study variation. Investigate heterogeneity and publication bias. Report transparently using PRISMA 2020 and rate the certainty of evidence using GRADE.
A well-conducted meta-analysis does not just combine numbers. It produces a quantitative synthesis that is more precise, more powerful, and more transparent than any single study could achieve on its own, and it makes explicit the assumptions and limitations that the reader needs to evaluate the result.
Frequently Asked Questions
How many studies do I need for a meta-analysis?
There is no strict minimum, but practical constraints apply. A meta-analysis with two studies is technically possible but produces a pooled estimate with limited value. Heterogeneity statistics (I-squared) are unreliable with fewer than five studies. Funnel plots and Egger's test for publication bias require at least 10 studies to be informative. Most published meta-analyses include 5 to 50 studies, though some include over 100.
What software should I use?
The most common options are R (packages: metafor, meta, dmetar), Stata (commands: metan, metabias, metafunnel), RevMan (Cochrane's free software), and Comprehensive Meta-Analysis (CMA, commercial). R's metafor package is the most flexible and widely used in published research. RevMan is the standard for Cochrane reviews and is accessible to non-statisticians.
Can I include both randomized and non-randomized studies?
Yes, but assess them with different risk-of-bias tools (RoB 2 for RCTs, ROBINS-I for non-randomized studies) and present them separately or in pre-specified subgroup analyses. Combining them in a single pooled estimate without accounting for the difference in study quality is not recommended.
What do I do when studies report results differently?
This is common. One study reports means and SDs, another reports medians and IQRs, a third reports only a p-value and sample size. Established conversion formulas exist for most common situations. The Cochrane Handbook provides guidance, and the metafor package in R includes functions for converting between formats. When conversion is not possible, contact the original authors for the underlying data.
How do I interpret I-squared?
I-squared tells you what percentage of the variation across study results reflects genuine differences rather than sampling error. An I-squared of 0% means all variation is consistent with random sampling. An I-squared of 75% means three-quarters of the observed variation reflects real differences between studies. High I-squared does not mean the meta-analysis is invalid; it means you should investigate why the studies differ and report the prediction interval alongside the confidence interval.
Should I use a fixed-effect or random-effects model?
Use a random-effects model in most cases. The fixed-effect assumption (that all studies estimate the same true effect) is rarely justified when studies differ in population, setting, or intervention details. The random-effects model accommodates this variation and produces a more realistic confidence interval. Report both models in a sensitivity analysis if reviewers or editors prefer to see the comparison.
What is the difference between a confidence interval and a prediction interval?
The confidence interval tells you the range within which the average true effect likely falls. The prediction interval tells you the range within which the true effect in a future study would likely fall. The prediction interval is always wider and gives a more honest picture of the variability in effects. Reporting both is increasingly recommended.
References
- Higgins, J. P. T., Thomas, J., Chandler, J., et al. (Eds.). (2019). Cochrane Handbook for Systematic Reviews of Interventions (version 6.0). Cochrane. https://doi.org/10.1002/9781119536604
- Glass, G. V. (1976). Primary, secondary, and meta-analysis of research. Educational Researcher, 5(10), 3-8. https://doi.org/10.3102/0013189X005010003
- Veroniki, A. A., Jackson, D., Viechtbauer, W., et al. (2016). Methods to estimate the between-study variance and its uncertainty in meta-analysis. Research Synthesis Methods, 7(1), 55-79. https://doi.org/10.1002/jrsm.1164
- Borenstein, M., Hedges, L. V., Higgins, J. P. T., & Rothstein, H. R. (2009). Introduction to Meta-Analysis. Wiley. https://doi.org/10.1002/9780470743386
- Wan, X., Wang, W., Liu, J., & Tong, T. (2014). Estimating the sample mean and standard deviation from the sample size, median, range and/or interquartile range. BMC Medical Research Methodology, 14, 135. https://doi.org/10.1186/1471-2288-14-135
- Page, M. J., McKenzie, J. E., Bossuyt, P. M., et al. (2021). The PRISMA 2020 statement: an updated guideline for reporting systematic reviews. BMJ, 372, n71. https://doi.org/10.1136/bmj.n71
- Guyatt, G. H., Oxman, A. D., Vist, G. E., et al. (2008). GRADE: an emerging consensus on rating quality of evidence and strength of recommendations. BMJ, 336(7650), 924-926. https://doi.org/10.1136/bmj.39489.470347.AD
Running a review?
Run your systematic review in Paperguide
Dual screening, verifiable extraction and PRISMA reporting in one place.
Start a reviewNo credit card required