How to Create a Literature Review Map: Steps and Template


To create a literature review map, collect the studies for your review, code each one in a matrix, group the codes into themes, choose a layout, draw and label the connections, and turn the map into your review outline. The matrix does the thinking; the map shows the result.
This guide covers an eight-step method built around a synthesis matrix, four layouts, a worked example on feedback in education with 12 real studies, three copyable templates, and how to turn the map into the outline of a literature review. It is written for students and PhD researchers planning a review chapter, and for evidence synthesis and HEOR teams planning a synthesis.
Key Takeaways
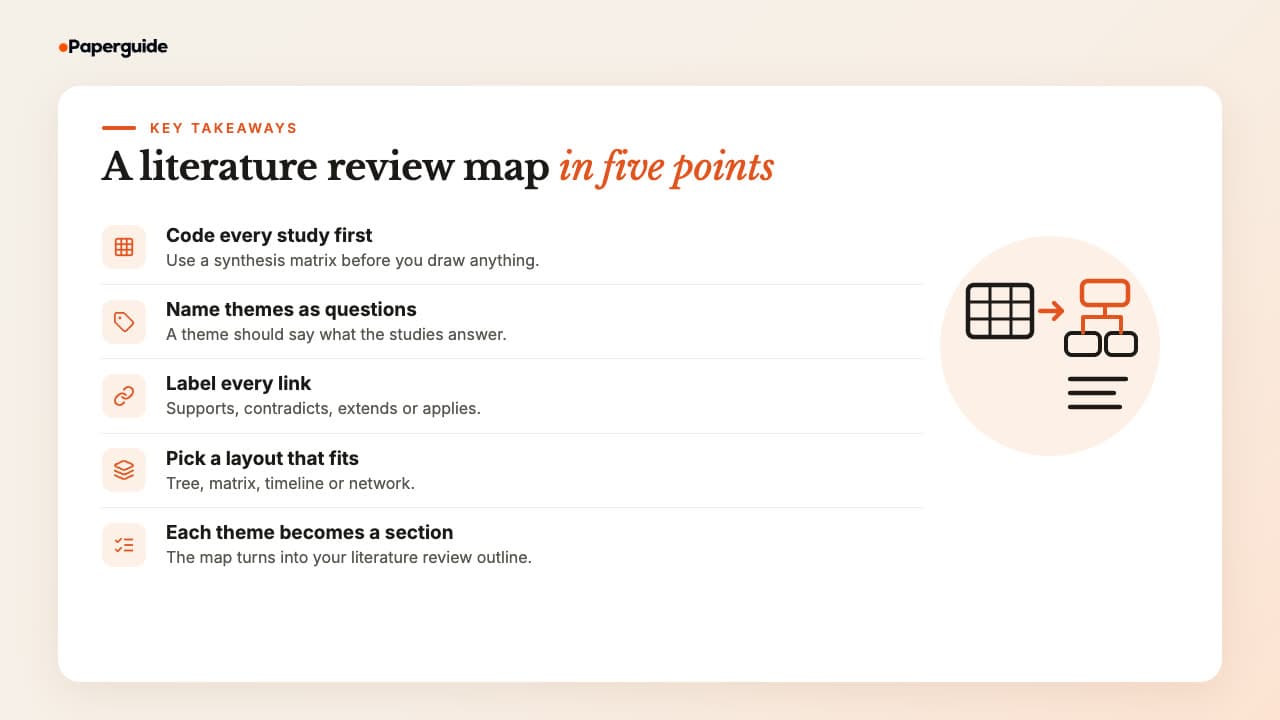
A literature review map is built in two passes: first a synthesis matrix that codes every study on the same columns, then a diagram that groups those codes into themes and labels how the studies relate. Each theme becomes a section of your review, so a good map is already a draft outline.
- Code every study in a synthesis matrix before you draw anything. The same columns for every study make patterns and gaps visible.
- Group the codes into three to six themes and name each one as the question its section of the review will answer.
- Label every link between studies with the relationship: supports, contradicts, extends or applies. An unlabelled line tells the reader nothing.
- Choose the layout to fit the review: a tree for a thematic review, a matrix for comparing studies, a timeline for how a field developed, a network for how studies connect.
- Each theme becomes a section, and each section follows the same paragraph plan: claim, evidence across studies, tension, gap.
What Is a Literature Review Map?
A literature review map is a thematic diagram of the studies you will review, drawn to plan the review itself. It groups the studies into themes, shows how they agree, disagree or build on each other, and marks where the evidence is thin. Its branches become the sections of your review.
Creswell and Creswell's Research Design treats this kind of map as a planning step before writing [1]. A literature review map narrows it to one review: every node is a study you will cite, and every branch is a section you will write.
"Literature map" also covers citation-based maps that tools build from citation links, which help you find studies rather than organise them. Both kinds are compared in the two types of literature map, and the citation-based kind is explained in what a citation map shows researchers.
What You Need Before You Start
Before you draw a literature review map you need five things: a focused review question, a documented search, a set of 15 to 30 core studies, the full texts or at least the abstracts, and a spreadsheet. Without the question, you have no basis for choosing themes. Without the spreadsheet, you will sort studies from memory.
- A focused question. "How does feedback affect learning in schools and universities?" can be mapped. "Feedback" cannot. If yours is still broad, start with how to write a focused research question.
- A documented search. Note databases, search terms and dates, even for a narrative review.
- 15 to 30 core studies. Fewer may be too few to show a pattern. More is fine for a systematic review, coded in batches.
- Full texts or abstracts. Code a first pass from abstracts, then check design and findings against the full text.
- A spreadsheet. One row per study, one column per thing you want to compare.
How to Create a Literature Review Map: Step by Step
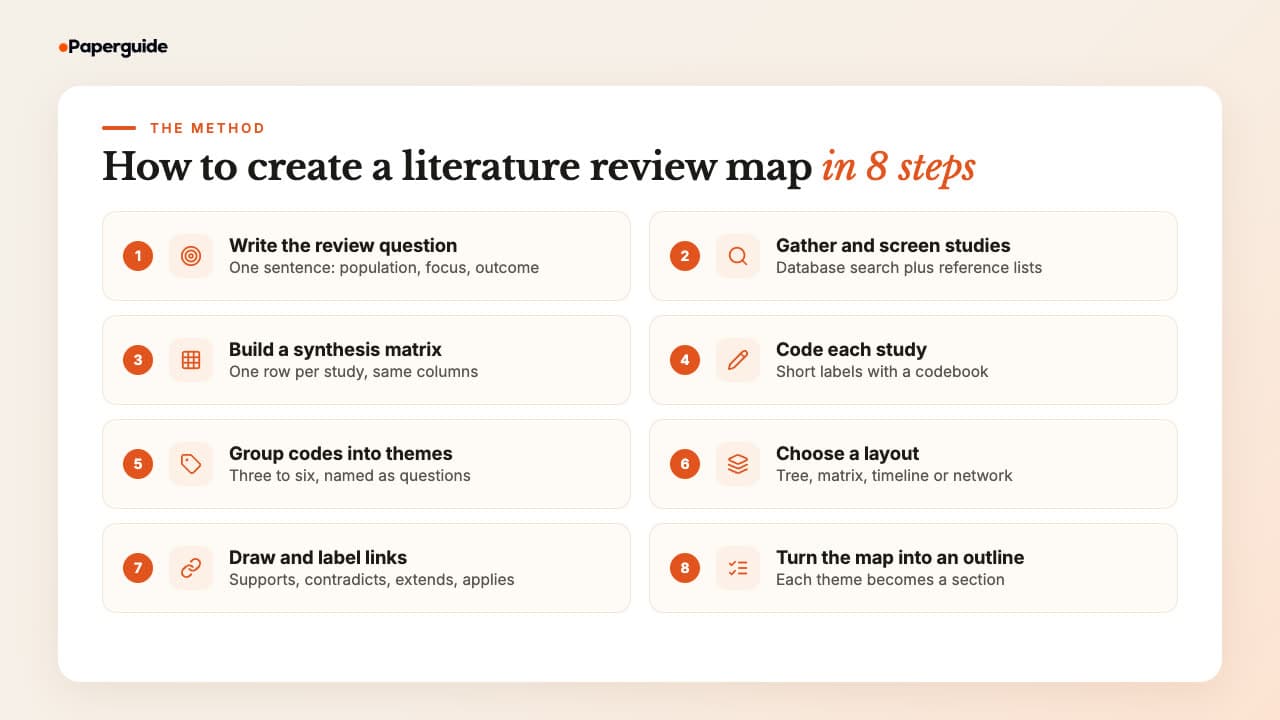
To create a literature review map, write the question your review answers, gather and screen your studies, build a synthesis matrix, code each study, group the codes into themes, choose a layout, draw the map with labelled links, and turn the map into your outline. Steps 3 to 5 are where the map is really made.
Step 1: Write the Question Your Review Answers
Write one sentence stating what your review is for, with its population or setting, focus and outcome: "How does feedback affect learning, what makes it effective and how do learners use it?" Every theme you add later should connect back to this sentence.
Step 2: Gather and Screen Your Studies
Run your database search strategy, then screen the results against written inclusion criteria so you can explain why each study is on the map and others are not. Add the reference lists of two or three recent reviews on your topic. Checking reference lists can catch studies your database search missed: in a Cochrane methodology review, the extra yield from reference lists ranged from 2.5% to 42.7% across the studies included [2].
A citation-based map helps with the same job. Paperguide's Citation Graph is free with no signup: you enter one to five seed papers by title or DOI and it ranks related papers by how closely they connect to your seeds, which can surface studies your keywords missed. The steps for turning seed papers into a citation map are set out separately. Saving the studies you keep to Paperguide's Reference Manager needs a free account and puts your screened set in one library for the steps that follow.
Step 3: Build a Synthesis Matrix
A synthesis matrix, also called a literature review matrix, is a table with one row per study and the same columns for every study. Typical columns are study, design, population, setting, key finding and concepts. Filling it forces you to read every study for the same things, which is what makes comparison possible.
If your studies are saved as papers in Paperguide, Extract Data can fill a first pass of the matrix: you define each column with a title and an instruction, it reads the full text of every selected paper, and each value is cited to the sentence it came from. Check every cell against that sentence before you code.
Keep findings in your own words, one or two lines, with the page you took them from. Here are six rows from our worked example on feedback in education, built around Hattie and Timperley's 2007 review "The Power of Feedback" [3]:
Synthesis Matrix Example: Study, Design, Population, Key Finding and Concepts
| Study | Design | Population and setting | Key finding (from the abstract) | Concepts |
|---|---|---|---|---|
| Kluger and DeNisi (1996) [4] | Meta-analysis, 607 effect sizes | Feedback interventions across settings | Average effect d = .41, but over a third of interventions lowered performance | Effect size; harmful feedback; attention to self |
| Wisniewski et al. (2020) [5] | Meta-analysis, 435 studies | Students, education research | Medium effect, d = 0.48, with significant heterogeneity; information content matters | Effect size; feedback content; outcome type |
| Shute (2008) [6] | Narrative review | Formative feedback research | Effective formative feedback is nonevaluative, supportive, timely and specific | Feedback content; timing; learner characteristics |
| Carless (2006) [7] | Survey across eight universities, plus student data | Students and tutors, higher education | Students and tutors perceive written feedback differently | Perception; dialogue; power and emotion |
| Eva et al. (2012) [8] | Focus groups, 134 participants | Health professional training programmes | Confidence, experience and fear can raise or lower receptivity | Receptivity; self-perception |
| Steiss et al. (2024) [9] | Comparison of feedback on 200 essays | Secondary school writing | Human feedback rated higher on most quality measures; differences not large in practice | Feedback quality; generative AI |
Step 4: Code Each Study
Coding means tagging each study with short labels for the ideas it addresses, so you can sort by idea instead of by author. Start with codes taken from your review question (deductive codes), then add codes the studies themselves raise (inductive codes). The Concepts column above is a first pass at coding.
Keep a short codebook: each code, a one-line definition and an example study. Without definitions, "feedback content" drifts to mean different things by row 25. When two codes keep appearing together, such as "perception" and "receptivity" in the example, note it. That pairing is usually the start of a theme.
Step 5: Group Codes Into Themes
Sort your codes into three to six groups, then name each group as a question your review will answer. "Effect size" and "outcome type" become "Does feedback improve learning, and by how much?" Then place each study under the theme where it does the most work. The grouping is your judgement; no table or tool makes it for you.
Test each theme against your Step 1 question. A theme that does not help answer it belongs in a different review. A theme holding most of your studies probably needs subthemes, as happened in our example.
Step 6: Choose a Layout
Pick the layout that matches the argument your review makes. A hierarchical tree suits a thematic review. A matrix map suits comparing studies on the same dimensions. A timeline suits a review about how ideas developed. A network suits showing how studies relate across themes. The next section compares the four.
Step 7: Draw the Map and Label the Links
Draw the themes first, then place the studies, then add lines only where a real relationship exists. Label every line with one of four words: supports (same conclusion), contradicts (different conclusion), extends (builds on or updates the earlier work) or applies (tests the idea in a new setting). Pencil is fine for a first draft; keep the matrix as the source, so a changed row means a changed map.
Step 8: Turn the Map Into Your Review Outline
Use the themes as section headings and the subthemes as subheadings, and write each labelled link as a sentence that compares studies. Order the sections so each one sets up the next, usually from the broadest question to the narrowest. The section on turning a literature review map into a literature review outline, below, shows the paragraph plan.
If you draft in Paperguide, the AI Paper Writer can start from an outline and draft a section from the papers in your Reference Manager, with every citation linked to a real paper. Give it one theme at a time and revise each draft against your paragraph plan.
Literature Review Map Layouts
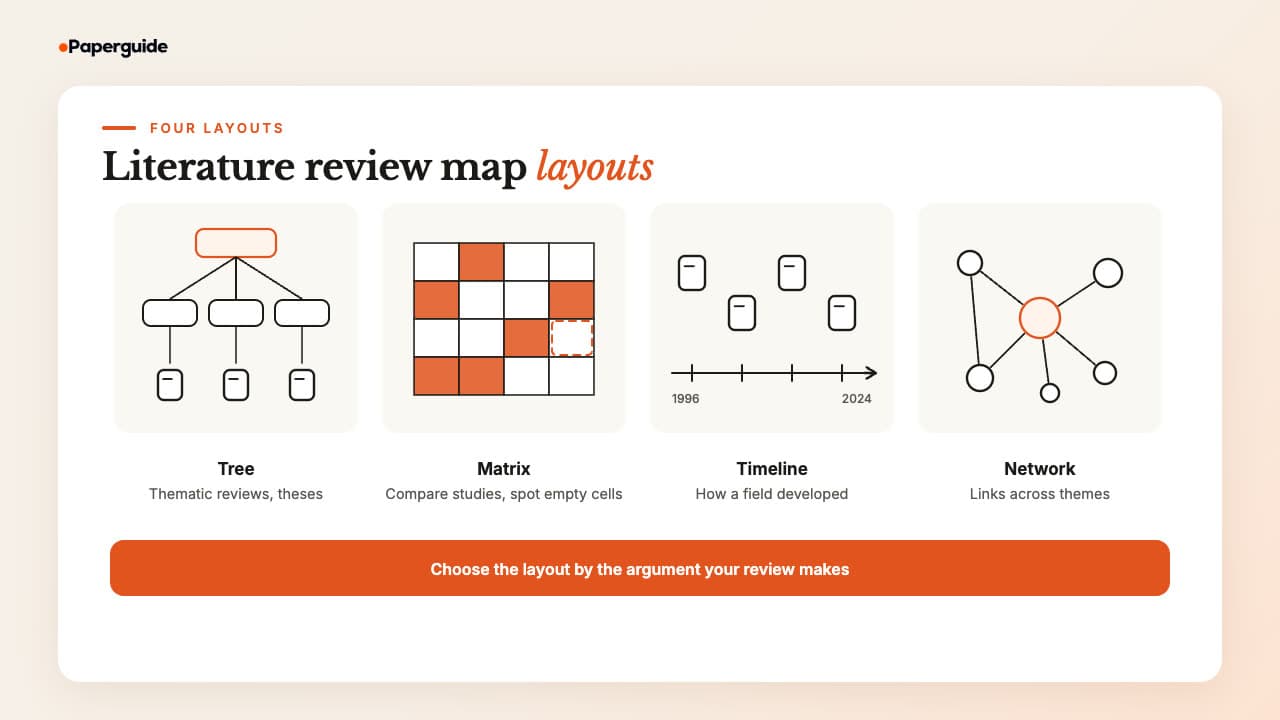
The four common literature review map layouts are a hierarchical tree, a matrix map, a timeline map and a network map. They hold the same studies but answer different questions: what the themes are, how studies compare, how a field changed over time, and how studies connect across themes. Choose by the argument your review makes.
Hierarchical Tree
Topic at the top, themes beneath, subthemes beneath those, studies at the ends. Its levels map directly to headings and subheadings, so it is the closest match to a written review. A study can sit in only one place, so cross-theme relationships need extra lines.
Matrix Map
Themes run down the rows and dimensions such as design, population or outcome run across the columns, with studies listed in each cell. Empty cells stand out at once, which makes this the best layout for spotting thin evidence.
Timeline Map
Studies sit along a time axis, grouped into periods, with arrows showing which work built on which. It suits reviews that trace how a concept or method developed, but it hides themes unless you colour-code them.
Network Map
Studies are nodes joined by labelled lines, with no fixed hierarchy. It shows best how two themes connect through a few bridging studies, but it clutters quickly as nodes multiply, so draw it for one argument at a time.
Which Literature Review Map Layout to Use
| Layout | Best for | Watch out for |
|---|---|---|
| Hierarchical tree | Thematic reviews and thesis chapters | Studies that belong to two themes |
| Matrix map | Comparing studies and finding empty cells | Losing the relationships between studies |
| Timeline map | Reviews about how a field or concept developed | Hiding themes behind chronology |
| Network map | Showing how studies connect across themes | Clutter beyond about 20 studies |
Literature Review Map Example: Feedback in Education
A literature review map example on feedback in education sorts 12 real studies into four themes: whether feedback improves learning, what makes it effective, how learners receive and use it, and whether technology can deliver it. The grouping, theme names and link labels are ours, built for this guide; another reviewer could reasonably group the same studies differently.
We took the studies from one run of Paperguide's free Citation Graph seeded with Hattie and Timperley (2007): the seed plus 11 of its top 20 related papers. That makes this a teaching sample, not a complete search, and each description below is limited to what the paper's title and abstract state.
- Review question: How does feedback affect learning, what makes it effective and how do learners use it?
- Theme 1: Does feedback improve learning, and by how much?
- Kluger and DeNisi (1996), a meta-analysis of feedback interventions on performance
- Wisniewski, Zierer and Hattie (2020), a meta-analysis of educational feedback research
- Theme 2: What makes feedback effective?
- Hattie and Timperley (2007), a conceptual review proposing a model of effective feedback
- Shute (2008), a review of formative feedback with guidelines
- Black and Wiliam (2009), a theory of formative assessment [10]
- Theme 3: How do learners receive and use feedback?
- 3a. Students in higher education
- 3b. Residents and health professionals
- Bing-You, Paterson and Levine (1997), residents' receptivity and sender credibility [13]
- Eva et al. (2012), factors that influence responsiveness to feedback
- Theme 4: Can technology deliver good feedback?
- Faber, Luyten and Visscher (2017), a randomised experiment with a digital formative assessment tool [14]
- Steiss et al. (2024), human and ChatGPT feedback on student writing compared
- Theme 1: Does feedback improve learning, and by how much?
Theme 1. Both meta-analyses find a positive average effect, d = .41 for Kluger and DeNisi and d = 0.48 for Wisniewski and colleagues, so the link between them is "supports". Both also report that the average hides a lot: over a third of interventions in Kluger and DeNisi lowered performance, and Wisniewski and colleagues found significant heterogeneity. That tension is the real finding of the theme.
Theme 2. Wisniewski and colleagues discuss their results in light of Hattie and Timperley's assumptions, so we drew that link as "extends", crossing from Theme 1 to Theme 2. Shute's review lists features of effective formative feedback, while Black and Wiliam place formative assessment within wider theories of pedagogy. They answer the same question at different levels: the feedback message, and the teaching around it.
Theme 3. This theme grew to five studies, so we split it. In higher education, Carless shows students and tutors see feedback differently, Sadler argues students need background knowledge to act on it, and Boud and Molloy position learners as seeking and generating feedback; we labelled the last two "extends" Carless. In medical education, both studies find that receptivity depends on more than the message, on credibility in one and confidence and fear in the other, so they "support" each other.
Theme 4. Faber and colleagues found positive effects of a digital tool on maths achievement and motivation in 79 primary schools. Steiss and colleagues measured the quality of feedback, not learning. Their quality criteria overlap with features Shute recommends, so we drew an "applies" link to Theme 2. With two studies measuring different outcomes, this is the thinnest theme on the map.
A thin theme is a prompt to search further. Before claiming that the effect of AI-generated feedback on learning is under-studied, you would need a dedicated search, which is where finding and testing research gaps comes in.
The map produces this outline:
- Introduction: why feedback matters and the review question
- Does feedback improve learning, and by how much?
- What makes feedback effective?
- How do learners receive and use feedback? (higher education; health professions education)
- Can technology deliver good feedback?
- Discussion: what the evidence supports, where it conflicts and what is missing
Literature Review Map Templates
Three literature review map templates cover the layouts that are easiest to build in a document or spreadsheet: a thematic tree, a synthesis matrix and a timeline table. Each also works as a general literature map template. Copy one and replace every bracketed field with your own studies.
Template 1: Thematic Tree
Fields in square brackets are template fields to replace.
- Review question: [one sentence with population, focus and outcome]
- Theme 1: [question this section answers]
- [Author, year], [design], [one-line finding]
- [Author, year], [design], [one-line finding]
- Links: [Study A] supports / contradicts / extends / applies [Study B]
- Theme 2: [question this section answers]
- Subtheme 2a: [narrower question] > [studies]
- Subtheme 2b: [narrower question] > [studies]
- Thin areas to check: [population, setting, design or outcome with few studies]
- Theme 1: [question this section answers]
Template 2: Synthesis Matrix
| Study | Design | Population | Setting | Key finding | Codes | Theme |
|---|---|---|---|---|---|---|
| [Author, year] | [design and sample size] | [who] | [where] | [one or two lines, your words] | [code 1; code 2] | [theme number] |
| [Author, year] | [design and sample size] | [who] | [where] | [one or two lines, your words] | [code 1; code 3] | [theme number] |
Sort the finished matrix by the Theme column and each block of rows becomes a section of your review.
Template 3: Timeline Map
| Period | Key studies | What changed | Link to the previous period |
|---|---|---|---|
| [years] | [Author, year; Author, year] | [the main idea or method of this period] | [starting point] |
| [years] | [Author, year; Author, year] | [what was added, questioned or tested] | [extends / contradicts / applies earlier work] |
| [years] | [Author, year; Author, year] | [current direction] | [extends / contradicts / applies earlier work] |
From Literature Review Map to Literature Review Outline
A literature review outline comes straight from the map: each theme becomes a section, each subtheme a subsection, and each labelled link a comparison sentence. Inside each section, write paragraphs that follow one plan: a claim, the evidence across several studies, the tension between them and the gap that remains.
Here is that plan applied to Theme 1 of the example:
- Claim: Feedback improves learning on average, but not reliably.
- Evidence across studies: Two meta-analyses, decades apart, find positive average effects of similar size.
- Tension: Over a third of interventions in the earlier meta-analysis lowered performance, and the later one found effects varied widely.
- Gap: The averages do not say which feedback helps whom, which is the question Theme 2 picks up.
The last line of each section should hand over to the next. If you cannot write that sentence, two sections may belong together or in a different order. Drafting each section is covered in the full literature review writing process, and structure by review type in the main types of literature review.
For a second view of the same evidence, Paperguide's Literature Review AI runs a Plan, Search, Screen, Extract, Synthesize sequence from your research question and reports where evidence converges and conflicts, each claim cited to a source paper. Compare its findings with your themes and keep the grouping that answers your question.

Literature Review Maps for Theses, Systematic and Scoping Reviews
A literature review map works for theses, systematic reviews and scoping reviews, but its job differs. In a thesis, it plans the literature review chapter and shows a supervisor the argument. In a systematic review, it plans the synthesis after the search is done. In a scoping review, a related evidence map charts how much research exists and where.
Thesis. Draw the map before drafting the chapter and bring it to supervision. A one-page map is far quicker to critique than a full draft.
Systematic review. Search and screening follow your protocol; the map comes afterwards, organising included studies for the narrative synthesis. If you ran citation-based checks, report them in the methods with dates and sources, following how to report backward and forward citation searching. For how the two review types differ, see systematic review vs literature review.
Scoping review. A scoping review charting a whole field can present its results as a chart of the evidence by population, concept and context. That is a matrix map at scale, with empty cells as its main output.
Common Mistakes When Creating a Literature Review Map
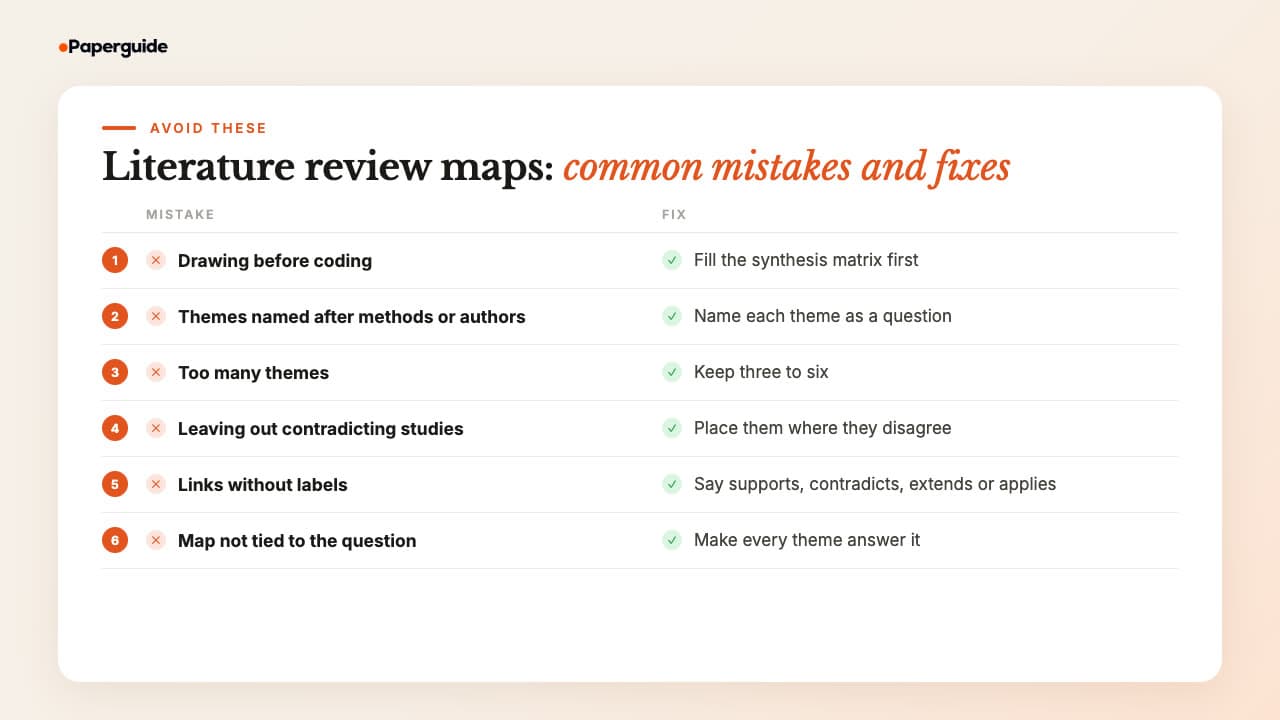
Six mistakes weaken literature review maps: drawing before coding, naming themes after methods or authors, creating too many themes, leaving out studies that disagree, drawing links without labels, and building a map that never connects back to the research question. Each makes the review that follows harder to write.
Drawing before coding. A map drawn from memory groups the studies you remember best. Fill the synthesis matrix first, then let the codes suggest the themes.
Themes named after methods or authors. "Randomised trials" or "Hattie's work" produces a review organised by study type or by person, which is description, not synthesis. Name each theme as a question about the topic.
Too many themes. Ten themes of two studies each is a list with headings. Merge until you have three to six, each with enough studies to compare.
Leaving out contradicting studies. A map with only agreeing studies hides the tension your review should explain. Kluger and DeNisi's finding that some feedback lowered performance is what makes Theme 1 worth writing.
Links without labels. A bare line could mean agreement, disagreement or simply "same topic". Label every link with supports, contradicts, extends or applies.
A map that never connects to the question. Interesting themes that do not help answer your review question make the review drift. Check every theme against your Step 1 sentence and cut those that fail.
Literature Review Map Checklist
A finished literature review map rests on a coded synthesis matrix, groups studies into three to six themes named as questions, keeps contradicting studies visible, labels every link and turns directly into an outline. Run these eight checks before you start drafting the review.
- [ ] The review question is one sentence, and every theme helps answer it
- [ ] Every study has a row in the synthesis matrix, coded on the same columns
- [ ] The codebook defines each code in one line with an example study
- [ ] Three to six themes, each named as a question, not a method or an author
- [ ] Contradicting studies are on the map, linked to the studies they disagree with
- [ ] Every link is labelled: supports, contradicts, extends or applies
- [ ] Thin themes and empty cells are noted as candidate gaps to search for
- [ ] Each theme maps to a section of the outline, in an order where each leads to the next
Try It Yourself (2 Minutes)
You can test the method on your own topic in about two minutes with studies you have already read. The point is to see how quickly coding three columns turns a pile of papers into two groups with questions as names.
- Pick six studies you already have on your topic and open a blank spreadsheet.
- Fill three columns for each: study, key finding in your own words, and one or two concept codes.
- Sort by the codes, split the six studies into two themes and write each theme's name as a question.
By the end you will have the first two branches of a literature review map and a sense of whether your codes are doing their job.
Conclusion
A literature review map is built mostly in the matrix. Code every study on the same columns, group the codes into themes named as questions, choose a layout that fits your argument and label every link. The map you draw is then a direct record of decisions you can defend.
From there, the outline follows directly from the map. Before you commit to the gap your map points to, check that the research gap is real, then move on to drafting your literature review section by section.
Frequently Asked Questions
The answers below cover what the guide has not answered head-on: what a template and an example look like, what a synthesis matrix is, which software to use, how many themes to aim for, how long mapping takes, where AI fits and whether a thesis needs a literature review map.
What is a literature review map template?
A literature review map template is a ready structure you fill in with your own studies. The most useful are a thematic tree (review question, themes, studies and labelled links), a synthesis matrix (one row per study, with design, population, finding, codes and theme) and a timeline table for reviews about how a field developed.
What is an example of a literature review map?
A review on feedback in education might map 12 studies into four themes: whether feedback improves learning (two meta-analyses), what makes it effective (three reviews and theory papers), how learners receive and use it (five studies across higher and medical education) and whether technology can deliver it (two studies). Labelled links show which studies support, contradict or extend others.
What is a synthesis matrix in a literature review?
A synthesis matrix, also called a literature review matrix, is a table with one row per study and the same columns for every study, such as design, population, setting, key finding and concepts. It lets you compare studies side by side, code them, spot patterns and gaps, and group them into the themes that become sections of your review.
What software can I use to make a literature review map?
Paper, a whiteboard or sticky notes work for a first draft. For a version you will update, use PowerPoint, Word, Google Slides, draw.io or Miro, and keep the synthesis matrix in Excel or Google Sheets. Citation-based mapping tools help you find studies before you map them, but the themes are still yours to decide.
How many themes should a literature review map have?
Three to six themes is a workable range for a typical review. Fewer than three usually means the review question is very narrow or the themes are too broad to guide writing. More than six suggests some themes hold only one or two studies and should be merged. A theme holding most of your studies may need splitting into subthemes.
How long does it take to create a literature review map?
The time to create a literature review map depends mostly on how many studies you code and how well you already know them. Coding the synthesis matrix takes the longest; drawing the map is quick once the themes are clear. Building the matrix as you read, rather than after finishing all the reading, spreads the work and keeps the codes consistent.
Can I create a literature review map with AI?
AI tools can summarise studies, suggest codes and draft a review structure, and citation-based tools can find related studies quickly. Grouping studies into themes that answer your question, and judging how studies relate, depends on reading them, so check every suggestion against the papers. Treat any automated structure as a draft to test against your own map.
Should I include a literature review map in my thesis?
A literature review map is not usually required in a thesis, but it can help. You can use the map to plan the literature review chapter and to discuss it with a supervisor, and some students include a simplified version as a figure or in an appendix. Check your department's guidance and ask your supervisor whether a figure would strengthen the chapter.
References
- Creswell, J. W., & Creswell, J. D. (2023). Research design: Qualitative, quantitative, and mixed methods approaches (6th ed.). SAGE. https://www.sagepub.com/en-us/nam/research-design/book270550
- Horsley, T., Dingwall, O., & Sampson, M. (2011). Checking reference lists to find additional studies for systematic reviews. Cochrane Database of Systematic Reviews, (8), MR000026. https://doi.org/10.1002/14651858.MR000026.pub2
- Hattie, J., & Timperley, H. (2007). The power of feedback. Review of Educational Research, 77(1), 81-112. https://doi.org/10.3102/003465430298487
- Kluger, A. N., & DeNisi, A. (1996). The effects of feedback interventions on performance: A historical review, a meta-analysis, and a preliminary feedback intervention theory. Psychological Bulletin, 119(2), 254-284. https://doi.org/10.1037/0033-2909.119.2.254
- Wisniewski, B., Zierer, K., & Hattie, J. (2020). The power of feedback revisited: A meta-analysis of educational feedback research. Frontiers in Psychology, 10, 3087. https://doi.org/10.3389/fpsyg.2019.03087
- Shute, V. J. (2008). Focus on formative feedback. Review of Educational Research, 78(1), 153-189. https://doi.org/10.3102/0034654307313795
- Carless, D. (2006). Differing perceptions in the feedback process. Studies in Higher Education, 31(2), 219-233. https://doi.org/10.1080/03075070600572132
- Eva, K. W., Armson, H., Holmboe, E., Lockyer, J., Loney, E., Mann, K., & Sargeant, J. (2012). Factors influencing responsiveness to feedback: On the interplay between fear, confidence, and reasoning processes. Advances in Health Sciences Education, 17(1), 15-26. https://doi.org/10.1007/s10459-011-9290-7
- Steiss, J., Tate, T., Graham, S., Cruz, J., Hebert, M., Wang, J., Moon, Y., Tseng, W., Warschauer, M., & Olson, C. B. (2024). Comparing the quality of human and ChatGPT feedback of students' writing. Learning and Instruction, 91, 101894. https://doi.org/10.1016/j.learninstruc.2024.101894
- Black, P., & Wiliam, D. (2009). Developing the theory of formative assessment. Educational Assessment, Evaluation and Accountability, 21(1), 5-31. https://doi.org/10.1007/s11092-008-9068-5
- Sadler, D. R. (2010). Beyond feedback: Developing student capability in complex appraisal. Assessment & Evaluation in Higher Education, 35(5), 535-550. https://doi.org/10.1080/02602930903541015
- Boud, D., & Molloy, E. (2013). Rethinking models of feedback for learning: The challenge of design. Assessment & Evaluation in Higher Education, 38(6), 698-712. https://doi.org/10.1080/02602938.2012.691462
- Bing-You, R. G., Paterson, J., & Levine, M. A. (1997). Feedback falling on deaf ears: Residents' receptivity to feedback tempered by sender credibility. Medical Teacher, 19(1), 40-44. https://doi.org/10.3109/01421599709019346
- Faber, J. M., Luyten, H., & Visscher, A. J. (2017). The effects of a digital formative assessment tool on mathematics achievement and student motivation: Results of a randomized experiment. Computers & Education, 106, 83-96. https://doi.org/10.1016/j.compedu.2016.12.001
Mapping literature?
Find the studies your map is missing
Add the key papers you already have and see the earlier, later and related work around them. Free, no signup.
Try Citation GraphNo credit card required