What Is a Citation Map? Definition, Types and Examples

A citation map is a diagram of research papers and the citations between them: each paper is a node, and each link shows one paper citing, being cited with, or sharing references with another. It shows how a body of research connects: which studies a field builds on, which papers later authors read together and where newer work branched off.
This guide explains what a citation map is, its parts and five main types, where the idea came from, three real maps read for meaning, and what citation maps are used for and where they fail. It is written for students and researchers starting their first literature review project as well as evidence synthesis and HEOR teams who use citation links to check a search.
Key Takeaways
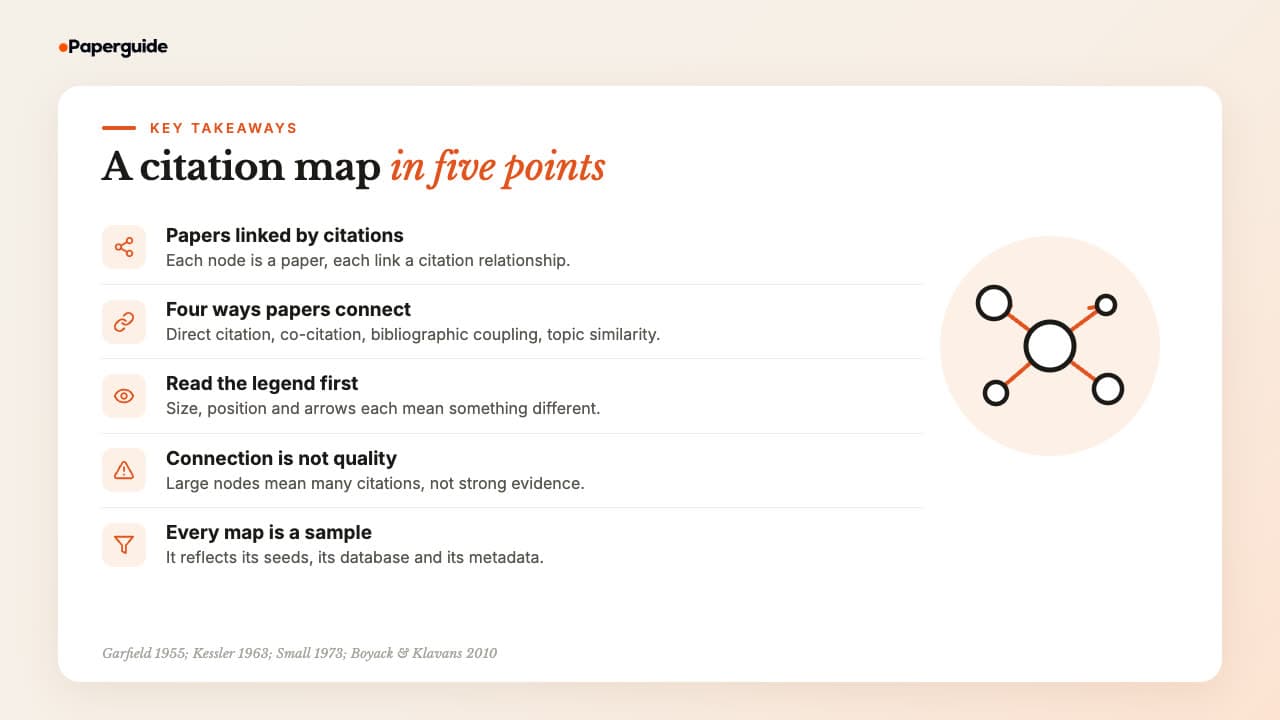
A citation map turns the citation record into a picture of how research papers connect. Papers are nodes, citation relationships are links, and the map grows outward from seed papers you choose. Read its legend before its shape, treat size as attention rather than quality, and remember that every map is a sample of the literature.
- A citation map is drawn from the citation record, so every line on it traces back to a reference list or a citing paper.
- Maps differ by what the links mean: direct citation, co-citation, bibliographic coupling, a hybrid of these, or topic similarity.
- Every visual element encodes something. Check what node size, position and arrows stand for before you draw conclusions from the picture.
- A large node means many papers cited it, for any reason, including disagreement. Citation counts measure attention, not the quality of the evidence.
- A map reflects its seeds, its database and its metadata. It is a ranked sample of the literature, so pair it with keyword search.
What Is a Citation Map?
A citation map is a diagram of research papers and the citations between them. Each paper is a node, each citation relationship is a link, and the map is usually built outward from seed papers you pick. Its purpose is to show structure that a list of search results hides: what came first, what followed and what belongs together.
The phrase has two other uses worth setting aside. Some services draw a geographic map of where the people citing a researcher are based, and style guides discuss how to cite a printed or online map. This guide is about neither. It covers maps of research papers.
The raw material is the citation itself. When paper A lists paper B in its references, the record holds a directed link from A to B, and a citation index collects those links so they can be drawn.
Seed-based tools, the kind most students meet first, start from a seed paper: a study you already know is relevant. The tool gathers the papers around it, so every such map is a view from somewhere. Change the seed and you change the map, which is why choosing seeds is the first step when you build a citation map around chosen seeds. If you have no seed yet, Paperguide's AI Search answers a plain-language question from cited papers, and its results can open a graph, and the Research Agent can build a graph for you in chat.
Citation Map vs Citation Graph vs Citation Network vs Citation Tree
Citation map, citation graph, citation network and citation tree describe the same idea at different levels. A citation network or citation graph is the data structure of papers linked by citations. A citation map is the visual you read. A citation tree is an older, informal name for a map drawn outward from a single paper in both directions.
The table sets out how each term is normally used, including two from bibliometrics.
Citation Mapping Terms Compared
| Term | What it means | Where you see it |
|---|---|---|
| Citation network | All papers and the citation links between them, as a structure that can be analysed | Bibliometrics and network science papers |
| Citation graph | The same structure in graph terms: nodes and directed edges. Also used as a product name | Computer science, and tools such as Paperguide Citation Graph |
| Citation map | A visual drawn from part of the network, usually around seed papers | Library guides, research tools, student guides |
| Citation tree | A map drawn outward from one paper: references as roots, citing papers as branches | Informal use and older guides |
| Co-citation map | A map whose links are co-citation counts rather than direct citations | Bibliometric studies and science mapping |
| Science map or bibliometric map | A map of a whole field, where nodes can be papers, authors, journals or terms | Research evaluation and science policy |
Citation chaining and snowballing are search methods; a map shows their results at once. A literature map is a separate idea again, and can be thematic or citation-based, as this guide on literature maps and their two types explains.
Anatomy of a Citation Map
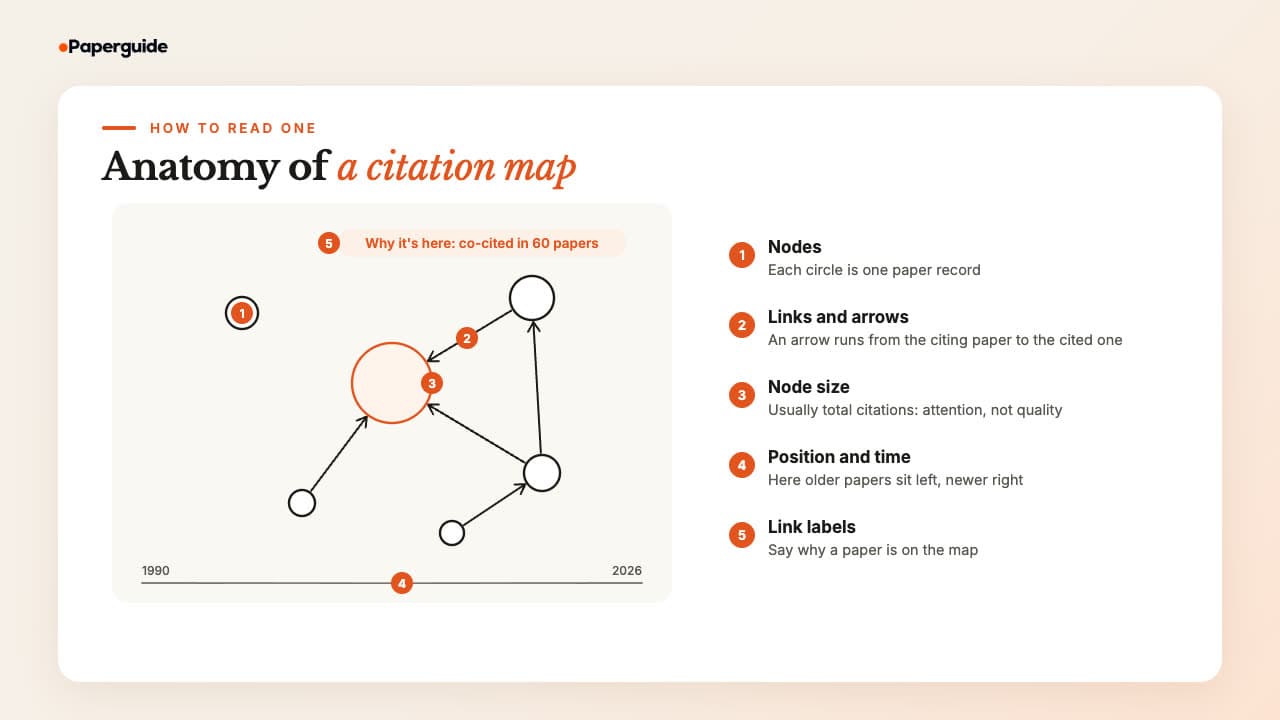
Every citation map is made of five parts: nodes for papers, links or arrows for relationships, node size for some measure of importance, position for time or closeness, and labels that explain why a paper is on the map. Each part encodes one piece of information, and misreading any one of them changes what you conclude.
Nodes
A node stands for one paper, or more precisely one record of a paper in the tool's database. The difference matters. A famous book or paper can exist as two records with slightly different titles, and then it appears as two nodes with its citations split between them. In our map of "The Power of Feedback", described below, Locke and Latham's 1990 book A Theory of Goal Setting and Task Performance appeared twice in the earlier work, as two 1991 records with 4,145 and 4,839 citations.
Links and Arrows
A direct citation link has a direction. The arrow runs from the citing paper to the cited one, so arrows point back in time: a paper can only cite work that existed when it was written.
Co-citation and bibliographic coupling links have no direction. They describe a shared pattern and carry a weight: the number of papers citing both, or the number of references two papers share.
Node Size
In most seed-based tools, node size encodes citation count. In Paperguide Citation Graph the legend says "Size = citations". The question to ask is which count. Eugene Garfield's citation mapping software, HistCite, showed two: a global citation score, "the number of times the paper is cited" in the whole citation index, and a local citation score, "the number of times the paper is cited in the collection" being mapped [1].
That distinction is a useful way to read size: a large global count tells you a paper is famous, while only a local count tells you it matters to the papers you are mapping. In our Transformer map, the largest node in the earlier work was a 2016 image recognition paper with 221,332 citations: a giant of computer science, but only one of many references behind the seed.
Position and Time
Position means one of two things, and the legend tells you which. In a timeline layout, the horizontal axis is publication date. Garfield's historiographs were arranged chronologically [1], and Paperguide Citation Graph places older papers on the left and recent ones on the right, with "Higher = more cited" on the vertical axis.
Other maps drop the timeline and let the layout pull connected papers together, so closeness reflects connection rather than date. Check the axis before you read the picture.
Labels That Explain a Link
A newer and useful part of a citation map is a plain statement of why each paper is there. Older maps drew a line and left you to guess.
In Paperguide's Citation Graph, each paper carries a "Why it's here" line, such as "Co-cited with your seed in 60 papers", along with chips for every other relationship it found, such as "Cites your seed" or "Shares 9 references". A paper with three kinds of link to your seed is a stronger candidate than one linked only by topic.
Types of Citation Maps
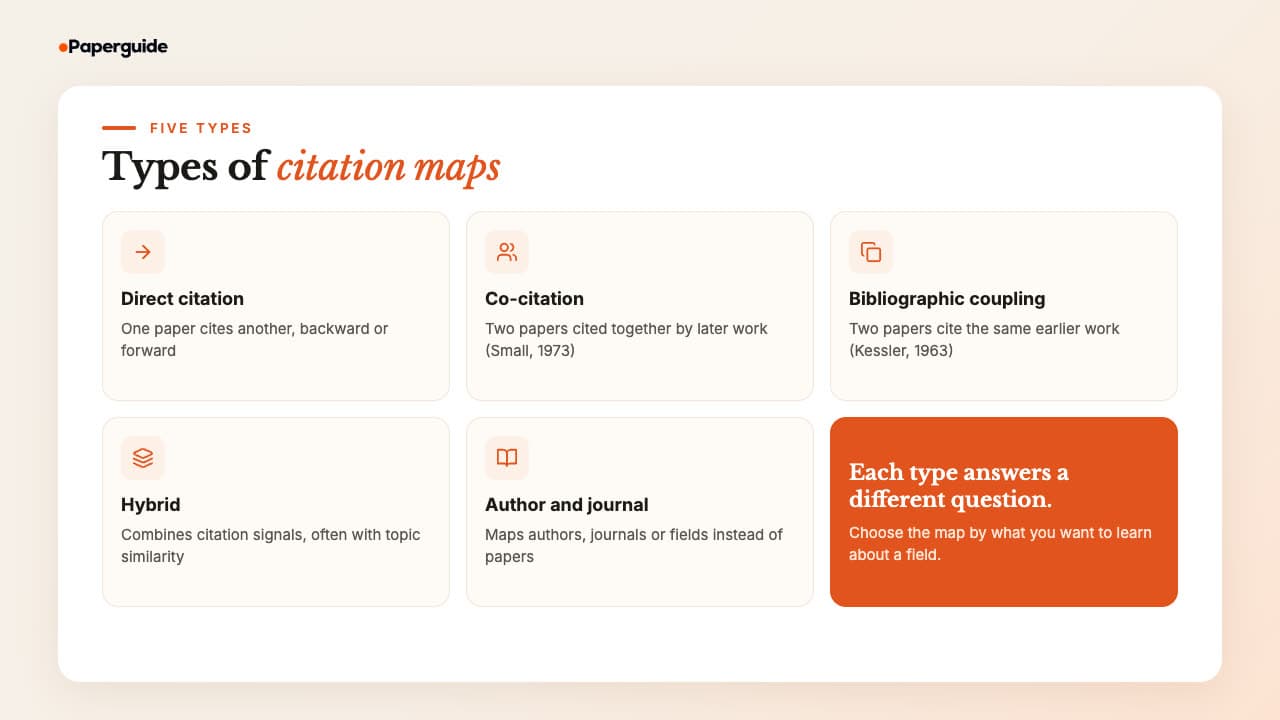
Citation maps are classified by what their links mean. Direct citation maps follow references and citing papers. Co-citation maps link papers that later work cites together. Bibliographic coupling maps link papers that cite the same sources. Hybrid maps combine these signals, and author, journal and field maps change the unit from papers to something larger.
Direct Citation Maps
A direct citation map draws the citation record as it is: arrows from each paper to the papers it cites. Built from one paper, it is the citation tree described above, with references behind and citing papers ahead.
It is also the sparsest. Two papers on the same question may never cite each other, especially if they appeared at the same time. At scale, Boyack and Klavans found direct citation the least accurate of the approaches they tested for grouping papers into research fronts [2].
Co-Citation Maps
A co-citation map applies co-citation analysis: it links two papers by how often later papers cite them together. Henry Small introduced the measure in 1973 [3], the same year I. V. Marshakova published a paper on co-citation clustering [1]. A high count means many authors, writing after both papers appeared, treated the two as belonging in the same discussion.
Co-citation is a judgement made by the field, not by either paper's authors, so it can connect a study to a rival it never cited, and it grows as new papers cite the pair. Small also found that "co-citation patterns are found to differ significantly from bibliographic coupling patterns, but to agree generally with patterns of direct citation" [3].
Bibliographic Coupling Maps
A bibliographic coupling map links two papers that cite one or more of the same earlier works. M. M. Kessler proposed the measure in 1963 as an objective way to group scientific papers by what they draw on [4]. Some tools, including Paperguide Citation Graph, call it shared references.
Coupling is the mirror image of co-citation. It looks backward, at what two papers build on, and it is fixed the moment both are published, because reference lists do not change. That is why it works for brand new papers: a study released last week has no citations yet, but its reference list already ties it to the rest of the field.
Hybrid and Similarity Maps
A hybrid map combines several citation signals, and some current tools add topic similarity from titles and abstracts. In their comparison across 2,153,769 biomedical articles, Boyack and Klavans reported that bibliographic coupling did slightly better than co-citation and that a hybrid of coupling with text similarity improved on coupling alone [2].
Paperguide Citation Graph is a hybrid of this kind. It ranks related papers using references, citing papers, co-citations, shared references and topic similarity, then labels which of those connect each paper to your seeds.
Author, Journal and Field Maps
Not every citation map is made of papers. Bibliometric science maps use authors, journals, institutions or terms as nodes, linked by citation, co-citation, bibliographic coupling or co-authorship.
Two established programs show the range. VOSviewer, developed at Leiden University's Centre for Science and Technology Studies, is described by its authors as "a freely available computer program" for bibliometric maps, and its launch paper displayed a co-citation map of 5,000 major scientific journals [5]. CiteSpace, developed by Chaomei Chen, models a specialty as research fronts and their intellectual base, which Chen defines as "its citation and co-citation footprint in scientific literature" [6]. Both work best for analysing hundreds or thousands of records exported from a bibliographic database.
A Short History of Citation Mapping
Citation mapping began with Eugene Garfield's 1955 proposal for a citation index of science. Kessler added bibliographic coupling in 1963, and Henry Small and I. V. Marshakova each introduced co-citation in 1973. Garfield later built software that drew chronological maps of a field, and from the 2000s mapping programs and large-scale tests turned the idea into everyday research tools.
Garfield's 1955 paper in Science proposed a citation index for a reason that still applies to every map. He wanted "a bibliographic system for science literature that can eliminate the uncritical citation of fraudulent, incomplete, or obsolete data by making it possible for the conscientious scholar to be aware of criticisms of earlier papers" [7]. The forward view in a modern map, the papers that cite a study, exists to do exactly that. Garfield's Institute for Scientific Information went on to publish the Science Citation Index, the first large source of the data maps are drawn from.
Kessler's coupling [4] and Small's co-citation [3] followed, and drawing maps came early too. Garfield recalled that a 1964 report he wrote with Sher and Torpie, on using citation data to write the history of science, showed that even a scholar with a photographic memory like Isaac Asimov could overlook some transitional key works in a field's development [1]. His HistCite software, described with Pudovkin and Istomin in 2003, produced "a chronologic map or flow diagram" of a topic's most cited papers and was designed to help identify "key linking or transition papers that may or may not be well cited" [1].
That same paper contains a detail every map reader should remember. Mapping the history of bibliographic coupling, Garfield found that his own 1955 paper was an essential predecessor of the work on bibliographic coupling, even though Kessler's 1963 paper did not cite it. He also found that some authors used the phrase "bibliographic coupling" in their titles without citing Kessler at all, so he added a title word search to fill the gap [1]. The founder of citation indexing needed keyword search to complete a citation map.
From the mid 2000s, CiteSpace and VOSviewer put science maps within reach of any researcher with a data export, and today's seed-based tools build a map around one paper in seconds.
Citation Map Examples
A citation map earns its place through what it reveals about a field. In three maps we built for this guide, one showed an idea moving from psychology into education, one traced evidence moving from trials into clinical guidelines, and one showed how a single faulty database record can distort the picture of a famous paper.
We built each map in Paperguide Citation Graph from a single seed in October 2026 and read the results by title. The numbers are a snapshot: a live tool's database keeps growing, so your counts will differ.
Education: The Power of Feedback
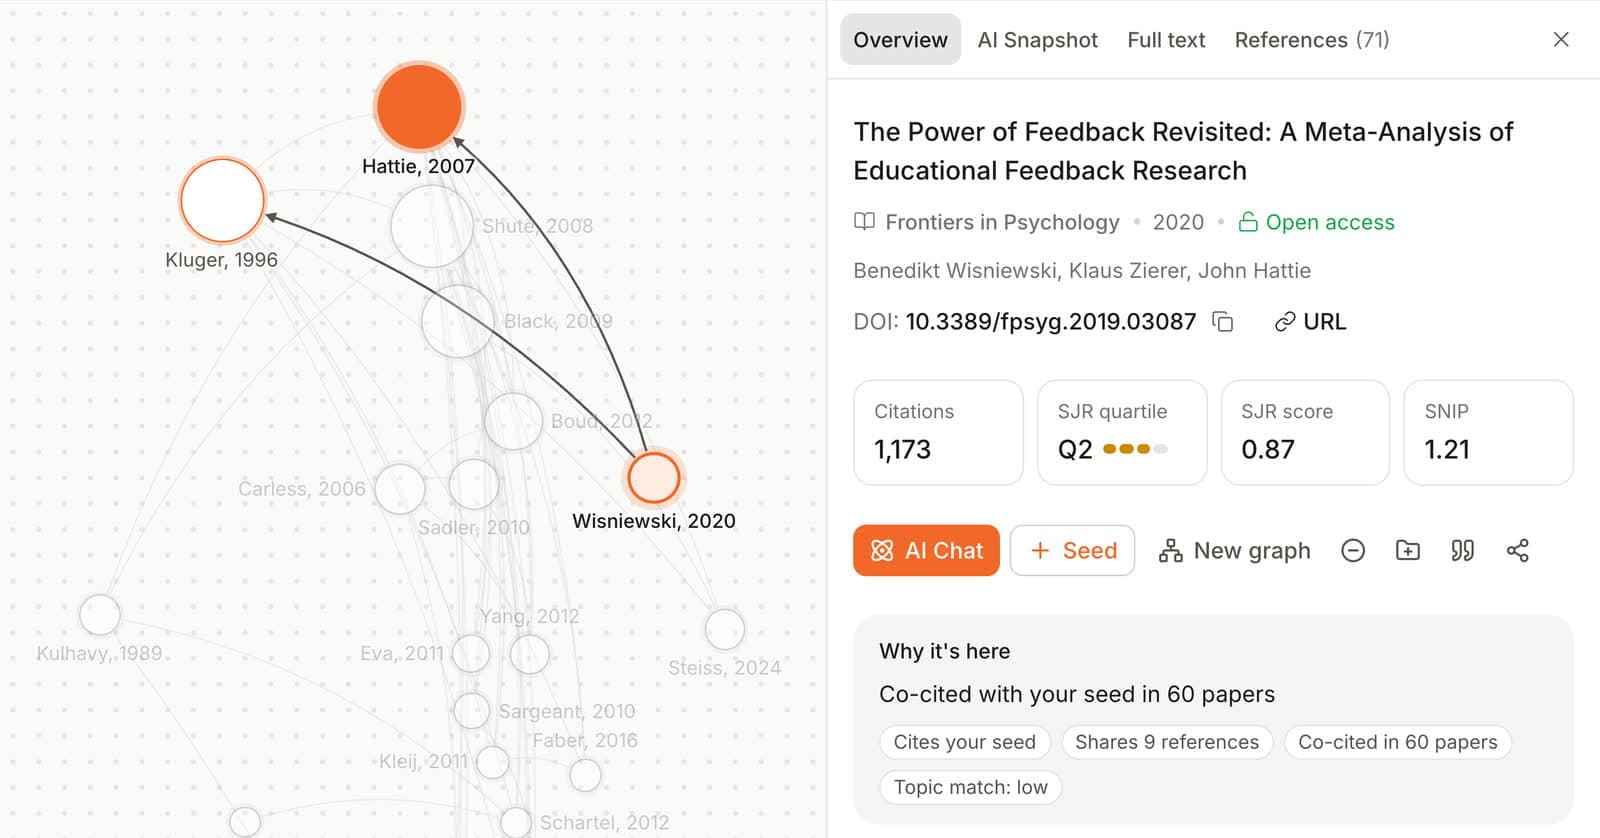
Hattie and Timperley's 2007 review "The Power of Feedback" is an education paper, but its earlier work reads like a psychology reading list: goal setting theory, a control theory account of self regulation from 1981 and a 1982 paper on self-efficacy with 15,351 citations. Its later work is classroom assessment and medical education, led by papers on assessment for learning, formative assessment and workplace-based assessment. Read left to right, the map shows a set of psychological ideas crossing into teaching.
Kluger and DeNisi's 1996 meta-analysis of feedback interventions appears in two roles. In the earlier work, the seed and six of its own references cite it, which marks it as a foundation. In the related papers, it is co-cited with the seed in 153 papers, which means later authors treat the two as a pair. A paper in both roles is core reading for the topic.
The 2020 meta-analysis by Wisniewski, Zierer and Hattie, "The Power of Feedback Revisited", shows a third role: a successor. It cites the seed, shares 9 references with it and is co-cited with it in 60 papers.
The newest branch points to a new question. The only paper from 2024 or later in the top 20 related papers was a 2024 study by Steiss and colleagues comparing human and ChatGPT feedback on student writing. It was already co-cited with the seed in 30 papers. A recent paper gathering co-citations that quickly can be an early sign of a new line of research.
Health: Cognitive Behavioral Therapy for Insomnia
Seeded with Trauer and colleagues' 2015 meta-analysis of cognitive behavioral therapy for chronic insomnia, the map shows evidence building in layers. The earlier work holds trials and meta-analyses from the 1990s and early 2000s, among them a 1994 meta-analysis of nonpharmacological treatments that the seed and 32 of its references cite. The seed is a meta-analysis built on earlier meta-analyses.
The strongest co-citation in the top 20 related papers did not belong to another trial. It belonged to the American College of Physicians clinical practice guideline on chronic insomnia (Qaseem and colleagues, 2016), co-cited with the seed in 238 papers, more than van Straten and colleagues' meta-analysis at 135. Co-citation at that level means later authors keep citing the evidence and the guideline together.
The later work completes the picture: European and American Academy of Sleep Medicine guidelines from 2017, a review in children and adolescents and an initiative to promote implementation. The map follows a treatment from trials to pooled evidence, then to guidelines, new populations and practice.
Computer Science: Attention Is All You Need
The third map, seeded with "Attention Is All You Need", matched a duplicate 2025 record instead of the 2017 paper, so its later work held only 2026 papers. The lesson applies to every tool: a map can only draw the links attached to the record it has, so check that the seed's year and citation count match the paper you meant. The full run is in our guide on how to create a citation map step by step.
What Is a Citation Map Used For?
Researchers use citation maps to get oriented in an unfamiliar field, to find relevant studies a keyword search missed, to check whether a systematic search is complete, to spot thin areas that may be research gaps and, through citation network analysis, to describe the structure of a whole field.
Getting Oriented in a New Field
A map answers your first questions about a topic in minutes: which papers everyone cites and what has happened since. Read the foundations in the earlier work and the most connected citing papers in the later work, and you have a reading order rather than a pile. Save what you keep to Paperguide's Reference Manager, which needs a free account.
Finding Studies a Keyword Search Missed
A keyword search can only return papers whose authors used the terms you typed, and even AI tools for finding research papers start from your wording. Citation links ignore vocabulary, so a map reaches studies that describe the same idea in other words. In Greenhalgh and Peacock's audit of 495 sources behind a review of complex evidence, 51% were found by snowballing, that is, by pursuing references of references, rather than by the planned database and hand searches [8]. New terms you meet on a map belong back in your search strategy.
Checking Completeness in Evidence Synthesis
Systematic review teams use citation links as a supplementary search, and a map is a fast way to see candidates around included studies; the formal method is set out in this guide to backward and forward citation searching in reviews.
Spotting Research Gaps
A map shows where the literature is dense and where it is thin. A population that appears only in recent, lightly cited work is a lead worth testing, but a thin area may only reflect your seeds or the database, so check it with a step-by-step method for finding research gaps.
Citation Analysis and Citation Network Analysis
Citation analysis counts and compares citations to papers, authors or journals. Citation network analysis applies the same maps at the scale of a field, to describe how disciplines connect, which journals form a community and how a research front moves. These are descriptive tools: they show where attention flows, not whether the work is good.
Limits of Citation Maps
A citation map is only as complete as the database behind it, it underrates recent work, it cannot tell agreement from criticism, it inherits every metadata error in its records, and it shows a ranked sample rather than every connected paper. Each limit below changes how far you can trust what a map shows.
Coverage. A map can only draw papers its database indexes. The same seed can produce different maps in different tools. If you need to compare sources, see this overview of how academic search engines differ in coverage.
Recency. Citations take years to build, so recent papers look small and rank low. In our three maps, only 1, 1 and 0 of the top 20 related papers were published in 2024 or later. Recent work showed up mainly in the later work, among papers citing the seed.
Citations are not endorsements. Garfield's original case for a citation index was to make "criticisms of earlier papers" visible [7]. A citation can mean agreement, disagreement or a passing mention, and a map draws them all as the same line.
Metadata errors. Duplicate records split a paper's citations, as with the two goal setting records and the Transformer duplicate above. The map pictures the records, and records contain errors.
A ranked sample, not a census. Tools rank and trim what they show. When we ran the insomnia seed, Later work listed 847 citing papers while the seed's record showed 1,050 citations. That is fine for discovery and wrong for a count.
Uncited relevant work. A paper that should cite your seed but does not will never appear through citation links, as Garfield found when papers with "bibliographic coupling" in their titles had not cited Kessler. Only topic similarity or a keyword search can reach it.
The papers a map finds still need reading, and grouping them into themes is your job, which this guide to building a literature review map covers.
Paperguide's free Citation Graph needs no signup: you start from 1 to 5 seed papers found by title or DOI, and it explains why each related paper is on the map.

Try It Yourself (2 Minutes)
The fastest way to understand a citation map is to open one for a paper you already know well. In about two minutes you can test what the earlier work says about its foundations and whether the reasons the map gives for a related paper match your own sense of the field.
- Search for a paper you know well by title or DOI in Paperguide's free Citation Graph, and check that the year and citation count match the paper you meant.
- Open Earlier work and find the largest node. Ask whether it is a foundation of your topic or simply a famous paper from a neighbouring field.
- Return to Related papers, open one paper you do not recognise and read its "Why it's here" line. Decide whether that link would make you read it.
By the end you will know how to read size, direction and link labels on a real map, and whether your own picture of the field matches the citation record.
Conclusion
A citation map is a picture of the citation record: papers as nodes, citation relationships as links, built outward from seed papers you choose. Each visual part carries one piece of meaning, each map type answers a different question, and every map is a ranked sample shaped by its seeds and database.
Look for foundations, companions, successors and new branches. Treat size as attention and every map as a sample. When you are ready to build one for your own topic, start from two or three seed papers you trust, then use what you find to write the literature review itself.
Frequently Asked Questions
What does a citation map show?
A citation map shows research papers as nodes and the citation relationships between them as links. Depending on the type, a link can mean one paper cites another, two papers are cited together by later work, or two papers cite the same sources. Node size usually shows citation counts, and position often shows publication date, so the map reveals foundations, successors and related studies at a glance.
Is a citation map the same as a citation network?
Not quite. A citation network is the full structure of papers and the citations between them, the data that can be analysed. A citation map is a visual drawn from part of that network, usually around one or more seed papers. A citation graph is the same network described in graph terms, and the word is also used as a tool name.
What is a co-citation map?
A co-citation map links two papers by how often later papers cite them together, a measure introduced by Henry Small in 1973 [3]. A high count means many authors treated the two papers as part of the same discussion. Co-citation reflects the judgement of the field rather than either paper's authors, and it grows over time as new citing papers appear.
What is the difference between co-citation and bibliographic coupling maps?
They look in opposite directions. A co-citation map links papers that later work cites together, so it reflects how the field reads them and keeps changing [3]. A bibliographic coupling map links papers that cite the same earlier work, so it reflects what they build on and is fixed once both are published [4]. Coupling suits brand new papers; co-citation needs time.
Who invented citation mapping?
No single person did. Eugene Garfield proposed the citation index in 1955, which made citation maps possible [7]. M. M. Kessler introduced bibliographic coupling in 1963, and Henry Small and I. V. Marshakova each introduced co-citation in 1973 [1]. Garfield later drew chronological maps of how a field developed, and in 2003 described HistCite, software that produced these maps from citation data [1].
Are citation maps reliable?
They are reliable for discovery and unreliable as a complete count. A map is limited by its database's coverage, underrates recent papers, cannot tell agreement from criticism and inherits errors such as duplicate records. Most tools also show a ranked sample. Use a map to find and prioritise papers, read them yourself, and combine it with keyword searching.
What is a citation map in Google Scholar?
Google Scholar lists the papers that cite a given paper and lets you follow those lists, but it does not draw a visual map of how papers connect. Some services use "citation map" to mean a geographic map of where a scholar's citing authors are located, which is a different thing. A map of research papers needs a dedicated citation mapping tool.
Is a citation map the same as a literature map?
No. A literature map is any visual overview of the research on a topic, and many are drawn by hand with no citation links at all, grouping studies under themes the researcher chooses. A citation map is narrower: every link comes from the citation record. Some literature maps are built from citations, which is where the two terms overlap.
References
- Garfield, E., Pudovkin, A. I., & Istomin, V. S. (2003). Why do we need algorithmic historiography? Journal of the American Society for Information Science and Technology, 54(5), 400-412. https://doi.org/10.1002/asi.10226
- Boyack, K. W., & Klavans, R. (2010). Co-citation analysis, bibliographic coupling, and direct citation: Which citation approach represents the research front most accurately? Journal of the American Society for Information Science and Technology, 61(12), 2389-2404. https://doi.org/10.1002/asi.21419
- Small, H. (1973). Co-citation in the scientific literature: A new measure of the relationship between two documents. Journal of the American Society for Information Science, 24(4), 265-269. https://doi.org/10.1002/asi.4630240406
- Kessler, M. M. (1963). Bibliographic coupling between scientific papers. American Documentation, 14(1), 10-25. https://doi.org/10.1002/asi.5090140103
- van Eck, N. J., & Waltman, L. (2010). Software survey: VOSviewer, a computer program for bibliometric mapping. Scientometrics, 84(2), 523-538. https://doi.org/10.1007/s11192-009-0146-3
- Chen, C. (2006). CiteSpace II: Detecting and visualizing emerging trends and transient patterns in scientific literature. Journal of the American Society for Information Science and Technology, 57(3), 359-377. https://doi.org/10.1002/asi.20317
- Garfield, E. (1955). Citation indexes for science: A new dimension in documentation through association of ideas. Science, 122(3159), 108-111. https://doi.org/10.1126/science.122.3159.108
- Greenhalgh, T., & Peacock, R. (2005). Effectiveness and efficiency of search methods in systematic reviews of complex evidence: Audit of primary sources. BMJ, 331(7524), 1064-1065. https://doi.org/10.1136/bmj.38636.593461.68
Mapping citations?
See how any paper connects
Start from up to five papers and explore earlier, later and related work in one free citation graph. No signup.
Try Citation GraphNo credit card required